Cloud analysis from METEOSAT data - PowerPoint PPT Presentation
1 / 1
Title:
Cloud analysis from METEOSAT data
Description:
Meteosat multi annual dataset of atmosphere and surface for climate analysis. ... and the satellite data on convective days is strongly dependant on the orography. ... – PowerPoint PPT presentation
Number of Views:79
Avg rating:3.0/5.0
Title: Cloud analysis from METEOSAT data
1
Cloud analysis from METEOSAT data climate model
validation
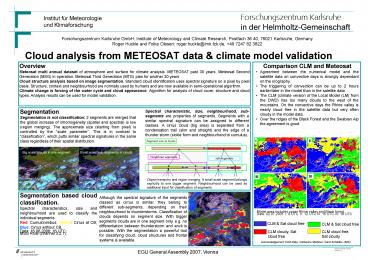
Overview Meteosat multi annual dataset of
atmosphere and surface for climate analysis.
METEOSAT past 30 years, Meteosat Second
Generation (MSG) in operation, Meteosat Third
Generation (MTG) plan for another 30 years Cloud
structure analysis based on image segmentation.
Standard cloud identification uses spectral
signature on a pixel by pixel basis. Structure,
context and neighbourhood are normally used by
humans and are now available in semi-operational
algorithm. Climate change is forcing of the water
cycle and cloud appearance. Algorithm for
analysis of cloud cover, structure and cloud
types. Analysis results can be used for model
validation.
- Comparison CLM and Meteosat
- Agreement between the numerical model and the
satellite data on convective days is strongly
dependant on the orography. - The triggering of convection can be up to 2 hours
earlier/later in the model than in the satellite
data - The CLM (climate version of the Local Model (LM)
from the DWD) has too many clouds to the west of
the mountains. On the convective days the Rhine
valley is nearly cloud free in the satellite data
but very often cloudy in the model data. - Over the ridges of the Black Forest and the
Swabian Alp the agreement is good.
Segmentation Segmentation is not classification
2 segments are merged that the global increase of
inhomogeneity (spatial and spectral) is low
(region merging). The approximate size (starting
from pixel) is controlled by the scale
parameter. This is in contrast to
classification, which putts similar spectral
signatures in the same class regardless of their
spatial distribution.
Spectral characteristic, size, neighbourhood,
sub-segments are properties of segments. Segments
with a similar spectral signature can be assigned
to different classes. A cirrus cloud (big area)
is separated from a condensation trail (slim and
straight) and the edge of a thunder storm (sickle
form and neighbourhood to cumulus).
Segmentation based cloud classification. Spectral
characteristics, size and neighbourhood are used
to classify the individual segments. Red
Cumulonimbus Yellow Cirrus at CB Blue Cirrus
without CB. Data 16.06.2006 16 UTC MSG RGB
(channel 3,2,1).
Although the spectral signature of the segments
classed as cirrus is similar, they belong to
different sub-segments, depending on their
neighbourhood to thunderstorms. Classification of
clouds depends on segment size. With bigger
segments clouds are in one segment only, e.g. no
differentiation between thunderstorm and anvil is
possible. With the segmentation a powerful tool
for classifying cloud, cloud structures and
frontal systems is available.
Model area includes upper Rhine valley and Black
forest. Date 02.07.2001. I 9 UTC II 12 UTC
III 15 UTC IV 18 UTC
Acknowledgement CLM-Data Cathérine Meißner, Gerd
Schädler (IMK)


