
Technical Analysis Of Stock Trends PowerPoint PPT Presentations
All Time
Recommended
Price patterns, charts and technical analysis: Technical Analysis Aswath Damodaran
| PowerPoint PPT presentation | free to download

Technical analysis is widely used by experts in the financial markets. It combines mathematics, statistics, and various techniques to analyze stocks. Learning the fundamentals of technical analysis is straightforward, and once you have that knowledge, you can easily apply it to analyze stocks.
| PowerPoint PPT presentation | free to download
Stock market analysis is a process that involves using available information to predict the future price of a stock. It is a more detailed investigation of the stock market that is intended to help investors make better decisions. You can also take guidance from the best Sebi registered research analyst in India. The aim in this article will be to define and explain what are the different methods of stock market analysis.
| PowerPoint PPT presentation | free to download

Niws (National Institute of Wall Street) is the best Training Institute for Stock Market Technical Analysis Course in Delhi. Learn share market courses from real life trader in live Classes. All trades are genuine and taught by our trainers at the time when they are Teaching Stock Market Technical Analysis Course in Delhi. This can be your first step towards Financial Freedom. Come with us and ride towards a new journey.
| PowerPoint PPT presentation | free to download

A lot of traders especially the beginner traders are being confuse about the differences between the fundamental and technical analysis. Here we explain the difference between fundamental and technical analysis, and discuss how to determine which investing approach is best for you.
| PowerPoint PPT presentation | free to download

Best stock analysis by experts for share market money investment in equity and commodity. stay update about NSE, BSE, Nifty, MCX market trading.
| PowerPoint PPT presentation | free to download
Indices Master, a leading stock investment advisor in the Indian market. As we’re aware of the current market scenario, it becomes easy for us to recommend stock options available to the investors.
| PowerPoint PPT presentation | free to download
Indices Master is highly experienced and most successful investment advisor for trading in stock market. We strongly believe in building partnership with clientand as a part of such belief, we do not charge any upfront fees nor do we have setup cost.Visit: http://www.indicesmaster.com/
| PowerPoint PPT presentation | free to download

Technical Analysis is study of the past price action to predict the future price Trends. This means that the price of a share tells us as to how the share is going to move in the future and any reasons, let it be Fundamental or Technical, that could lead to a rise or a fall in the share prices is reflected in the price of that share.
| PowerPoint PPT presentation | free to download

It might be your dream to become a successful investor who earns enough to live a good life, but you may not know the real scenario in Stock Market Technical Analysis India (manishhathiramani.com). Just considering an Online Stock Market Advice (http://manishhathiramani.com/media-record-economic-times) from a good share broker in not enough. You can only make profit by studying the stock market and following Stock Market Technical Analysis Kolkata and performances of various industries in India. Proprietary trading in India is a profitable platform that is helping investors in making positive investments. To become a pro- investor you need to study stock market trends and advices from reliable advices by experts. Knowledge about various investment opportunities and risks is one of the most important factors to be considered in the investment process.
| PowerPoint PPT presentation | free to download

Fundamental and technical analysis, play an important role in anticipating the movement of the stocks. The traders are advised to take the help of expert advisory firms like ProfitAim Research to trade effectively in the Stock Market. These advisory firms provide stock tips in form of Stock Cash Tips, after proper technical and fundamental analysis.
| PowerPoint PPT presentation | free to download

Though the market is extremely volatile, the right person with the access to identify the market condition can reduce the possible risk of investing in trading.
| PowerPoint PPT presentation | free to view

The Stock Market Analysis Course is a comprehensive course that provides a foundation in fundamental and technical analysis for those seeking rational investment decisions.
| PowerPoint PPT presentation | free to download

Explore our comprehensive online technical analysis course tailored for beginners to advanced traders. Master essential concepts like chart patterns, indicators, and trend analysis. Gain practical skills through interactive lessons and real-world examples. Start your journey to becoming a proficient trader today!
| PowerPoint PPT presentation | free to download
Technical Analysis Course
| PowerPoint PPT presentation | free to download

Embark on your journey into the world of our comprehensive technical analysis course online. Dive deep into the intricacies of chart patterns, indicators, and market trends. Gain practical skills to analyze stock movements and make informed trading decisions. Start mastering the art of technical analysis today!
| PowerPoint PPT presentation | free to download

Technical Analysis. The study of current and historic Price and Volume action to: ... The Magic of Technical Analysis is not in. Charts, Indicators, or Computers. ...
| PowerPoint PPT presentation | free to view

Elliot Wave adherents also make extensive use of the Fibonacci series. ... Avoid Bear Markets. Long and Short Major Swings. Long and Short Every 5% Swing. Page .
| PowerPoint PPT presentation | free to view

These stock market analysis courses blend theory with practical skills, equipping individuals with the tools to navigate and excel in the stock market.
| PowerPoint PPT presentation | free to download

Technical Analysis Chapter 16 Chapter 16 Technical Analysis Questions to be answered: How does technical analysis differ from fundamental analysis?
| PowerPoint PPT presentation | free to view

A stock market analysis course by Stock Tutor is a great online source to learn the rudiments of finance, make smarter investment decisions, and strive for a trading career.
| PowerPoint PPT presentation | free to download

Technical Analysis. Timothy R. Mayes, Ph.D. FIN 3600: Chapter 8. Introduction. Technical analysis is the attempt to forecast stock prices on the basis of market ...
| PowerPoint PPT presentation | free to view

Recent upward trends in DJIA are buy signals ... detected, a hypothetical portfolio is fully invested in DJIA ... Provide significant forecast power over DJIA ...
| PowerPoint PPT presentation | free to view
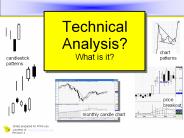
Analysis? What is it? chart patterns candlestick patterns price breakout monthly candle chart Slides prepared for ATAA use courtesy of: www.robertbrain.com
| PowerPoint PPT presentation | free to download
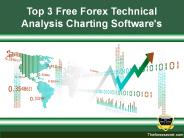
Here we will discuss Top 3 Free Forex Technical Analysis Charting Software. It is important for you as a trader to have charting software that gives you live Forex charts and live stock charts for your technical analysis. Analyzing Forex and stock charts is a problematic task for every investor if he/she does not have great charting software. You should be able to plot your favorite technical indicators such as closing price, trading volume, Bollinger bands and moving averages, appropriate for technical analysis to help identify market trends and reversals. These free charting software has great Forex charts and stock charts will serve as a great resource for traders that want a compliment to their current charting software as well as new traders learning technical analysis and charting.
| PowerPoint PPT presentation | free to download

Technical Analysis 101 : Session 6. Stanley Yabroff. Val Alekseyev. Rules for trading. ... Major bottom for stocks. Similar pattern would apply to market tops.
| PowerPoint PPT presentation | free to download
The country's economic strength, as well as its development, is related in this regard. The Technical Analysis Of The Financial Market includes terms of the market like investments and prices of the shares. These also help in fixing the wealth of the households and other consumption-related issues.
| PowerPoint PPT presentation | free to download
In this chart, we see that the stock essentially bounces up every time the stock gets near or on the 10-week moving ... Chart Basics Basic Terms Charts Chart ...
| PowerPoint PPT presentation | free to download

Putting money in stocks can turn profitable, yet you must grasp difficult trading tactics. Luckily, numerous stock courses are present in India for beginners. They provide thorough teaching and certificates. These are the best stock market courses for folks aspiring to excel in trading.
| PowerPoint PPT presentation | free to download

Swiggs Financial Learning - Best Indian Stock Market Technical Analysis in Delhi! We are the best training center for Swiggs trading technical analysis and Swiggs stock market technical analysis in Delhi.
| PowerPoint PPT presentation | free to download

Here mentioned some types of technical analysis premises. It is important that you create your own trading plan. If your perception of technical analysis is wrong, quick rich method, you have already started a lost war.
| PowerPoint PPT presentation | free to download
Technical analysis is a chart-based approach to study of market trends and is based on the following premises.
| PowerPoint PPT presentation | free to download

Technical and fundamental analysis are stock research techniques that consist of evaluating securities based on company performance, as opposed to relying on the performance of the market as a whole. This article is focused on what is technical and fundamental analysis from share market point of view.
| PowerPoint PPT presentation | free to download

CHAPTER 7 Stocks, Stock Valuation, and Stock Market Equilibrium * 16 17 18 14 20 21 24 33 25 For value box in Ch 4 time value FM13. 25 26 28 28 29 30 31 32 32 32 32 ...
| PowerPoint PPT presentation | free to view

Mandestocks provides information on Indian Stock Market - you can get daily Indian stock tips, market trend, stock quotes and analysis. Visit http://www.mandestocks.com/ for more details.
| PowerPoint PPT presentation | free to download
We'll be going over strategies using charts to buy stocks. Timing market bottoms ... This is going to be the most technical / complicated part so make sure you ...
| PowerPoint PPT presentation | free to download

12 minutes ago - COPY LINK HERE : share.bookcenterapp.com/powers/B0C3J79P7S | [READ DOWNLOAD] Reading Price Charts Bar by Bar: The Technical Analysis of Price Action for the Serious Trader (Wiley Trading, Book 416) | While complex strategies and systems may work for some traders, understanding price action is all you really need to succeed in this arena. Price action analysis is an eff
| PowerPoint PPT presentation | free to download

In 2023, the Booming Bulls Academy emerges as the Best Trading Institute in 2023, offering a comprehensive technical analysis course. In this article, we will delve into why Booming Bulls Academy's course stands out as the best option for mastering technical analysis and gaining an edge in the trading world. So, lets begin the quest to know why Booming Bulls Academy has gained the title of the best trading institute in 2023.
| PowerPoint PPT presentation | free to download

12 minutes ago - COPY LINK HERE : share.bookcenterapp.com/powers/B0C3J79P7S | [READ DOWNLOAD] Reading Price Charts Bar by Bar: The Technical Analysis of Price Action for the Serious Trader (Wiley Trading, Book 416) | While complex strategies and systems may work for some traders, understanding price action is all you really need to succeed in this arena. Price action analysis is an eff
| PowerPoint PPT presentation | free to download

Trin statistic. Odd-lot trading (contrarian) Confidence index. Put/call ratio (contrarian) ... Trin statistic. Trin statistic. or: Measures the expectations of ...
| PowerPoint PPT presentation | free to view

12 minutes ago - COPY LINK HERE : share.bookcenterapp.com/powers/B0C3J79P7S | [READ DOWNLOAD] Reading Price Charts Bar by Bar: The Technical Analysis of Price Action for the Serious Trader (Wiley Trading, Book 416) | While complex strategies and systems may work for some traders, understanding price action is all you really need to succeed in this arena. Price action analysis is an eff
| PowerPoint PPT presentation | free to download
Technical analysts apply the law of supply and demand to understand how the stock market and other securities exchanges work, identifying trends and profiting from them. Secured Options is today’s leading binary options trading platform. As binary options have become more popular than ever, secured options provides traders with an excellent trader experience in terms of security, features, user-friendliness, tools, and education. https://uk.linkedin.com/in/secured-options-27984a106 https://twitter.com/securedoptions
| PowerPoint PPT presentation | free to download
... for small firms than for larger firms, and roughly half ... The Holiday Effect: Is there one? Aswath Damodaran. 32. Volume and Price: The Evidence ...
| PowerPoint PPT presentation | free to download

The top short-term trading indicators for technical analysis are the ones that are most often used when beginning a new trading day. You can also opt for stock market courses to know more about technical analysis. Whether you work off a daily, weekly or monthly chart these are the charts that give the biggest picture of what the stock or commodity might do on a day to day basis.
| PowerPoint PPT presentation | free to download

In New Thinking in Technical Analysis: Trading Models from the Masters, a dozen top authorities reveal their techniques and strategies for successful trading. This book offers market participants a treasury of tools to improve their investment performance, each from a unique and time-tested perspective. divergence characteristic, which warns a trader about an upcoming trend change. I would, first of all, like to put some light on the RSI before explaining how to use it.
| PowerPoint PPT presentation | free to download

Nifty Trading Academy Review For Basic of Technical Analysis For More Detail : http://niftytradingacademy.net/
| PowerPoint PPT presentation | free to download

Adam Smith Associates Pvt Ltd is one of India's leading Trade Finance Company, performing business of arranging trade finance and providing consultancy, advisory, structuring and management services relating to trade finance transactions. One of its main expertise is in commodity trade finance. Adam Smith Associates work hand in hand with Indian and International corporations and banks to manage complex trade finance structures. Its corporate office is located in New Delhi - the capital of India, while one of the branch is at Indore. Internationally its affiliates are based in Singapore, Dubai, Hong Kong, Tokyo and Nigeria.
| PowerPoint PPT presentation | free to download
Take lessons from previous investment mistakes and trade along with sure shot intraday stock future tips generated by stock market experts.
| PowerPoint PPT presentation | free to download
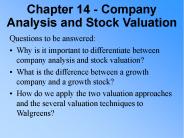
How do we apply the two valuation approaches and the several valuation techniques to Walgreens? ... Future Value for Walgreens. Additional Measures of Relative ...
| PowerPoint PPT presentation | free to download
Investors expect the risk free rate as well as a risk premium to compensate for ... Real rate of return is basic exchange rate in the economy ...
| PowerPoint PPT presentation | free to download

A modest outlook has been witnessed in the rolling stocks market in the past decade, in line with significant railway infrastructure investments made by national governments.
| PowerPoint PPT presentation | free to download

... Probus Publishing Company, Chicago,1991 J.J.Murphy, Technical analysis of the futures markets, ... the process to Fibonacci ... charts display an
| PowerPoint PPT presentation | free to download
Every trader, new or experienced, has to be aware of what technical analysis is. It is basically the study of investor behavior which effects the subsequent price action of the financial instruments. The main data which you will need for performing the studies is the price history of the instrument, time and the volume information. https://www.integraoption.com/
| PowerPoint PPT presentation | free to download

APF Trading Technical Analysis Market Commentary 22 Feb 2011
| PowerPoint PPT presentation | free to view

Beginners should first know that the essential element of stock trading is to spend in a company that you recognize will develop in future. Here are few stock market trading tips and system for thriving trading and investing in Indian stock market.
| PowerPoint PPT presentation | free to download