
Dynamic Visualization PowerPoint PPT Presentations
All Time
Recommended
Visualpath is Best institute in Hyderabad offers top Microsoft dynamics 365 training Courses with real-time expert instructors and hands-on projects. MS Dynamics CRM Training in Hyderabad, from industry experts and gain experience We provide to individuals globally in the USA, UK, etc. To schedule a demo, call +91-9989971070. Course Covered: Microsoft Dynamics 365, Power Apps, Power Automate, Power BI, Azure Logic Apps, Microsoft SharePoint, Dynamics 365 Sales, Microsoft Flow, AI Builder Whatsapp: https://www.whatsapp.com/catalog/919989971070 Visit our Blog: https://visualpathblogs.com/ Visit: https://www.visualpath.in/online-microsoft-dynamics-crm.html
| PowerPoint PPT presentation | free to download
Augmented Virtual Environments AVE: Dynamic Event Visualization
| PowerPoint PPT presentation | free to download
Understanding Data Intensive Systems Using Dynamic Analysis and Visualization Nesrine NOUGHI Motivation and Context Understanding = up to 50% of the cost of the ...
| PowerPoint PPT presentation | free to download
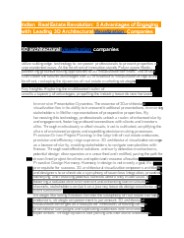
Here is how the construction industry can leverage the Dynamics 365 Map civilization for increased sales.
| PowerPoint PPT presentation | free to download

Title: Visualizing and discovering materials science concepts: Creating an engaging pedagogy with spreadsheets Author: SINEXSA Last modified by
| PowerPoint PPT presentation | free to view

DataWear: Revealing Trends of Dynamic Data in Visualizations. Late Breaking Hot Topics, Infovis Symposium 2001 ... Some solutions to visualize dynamic data ...
| PowerPoint PPT presentation | free to view

Here is how to improve Supply Chain in Manufacturing Industry with Dynamics 365 Map Visualization.
| PowerPoint PPT presentation | free to download

In-Situ Visualization and Analysis of Petascale Molecular Dynamics Simulations with VMD John Stone Theoretical and Computational Biophysics Group
| PowerPoint PPT presentation | free to download

Programming for Image Processing/Analysis and Visualization using. The Visualization Toolkit ... Custom libraries e.g. to read/write certain medical image formats ...
| PowerPoint PPT presentation | free to download

Seminar 2: Efficient Algorithms for Molecular Dynamics Simulations and Other Dynamic Spatial Join Queries Andrew Noske Thesis & code is available at:
| PowerPoint PPT presentation | free to download
... of Visual Cues. Visual Illusions. Tufte's notions ... Visual Illusions. People don't perceive length, area, angle, brightness they way they 'should' ...
| PowerPoint PPT presentation | free to download

Real-time data visualization transforms supply chain management by providing real-time insights into logistics, inventory, and operations. Learn how this technology ensures efficiency, reduces disruptions, and improves decision-making in dynamic supply chain environments.
| PowerPoint PPT presentation | free to download

Use of ADAMS Multibody Dynamics Simulation Software for Teaching ... Automotive systems. Robotic systems. Aerospace ... Not enough detail was discussed in ...

Data visualization is emerging as an important skill in data science and other respective data-driven industries, including education, finance, and healthcare. Since data professionals grapple with increasing volumes of complex and diverse data, data visualization evolves as an essential toolkit. Once considered a minor concept in data science, today, data visualization is a dynamic and fast-paced field, nurtured with multiple techniques, tools, theories, and contributions from other disciplines, such as neuroscience and psychology.
| PowerPoint PPT presentation | free to download

Lecture 26 Network dynamics Slides are modified from Lada Adamic and Jure Leskovec
| PowerPoint PPT presentation | free to view

Lecture 20 Network dynamics Slides are modified from Lada Adamic and Jure Leskovec
| PowerPoint PPT presentation | free to view

Migrate to Cloud with Microsoft Dynamics 365 to get a holistic view of your business with a centralized source. Take experts' help. it consultants usa Data Visualization Services USA Data Visualization Go Beyond Excels and Text-heavy Reports. SAT’s Data Visualization Services makes
| PowerPoint PPT presentation | free to view

As a highly comprehensive programming language, Python’s market advantage relies on its range of Data Visualization Tools. Packed with powerful features, such tools for data visualization are suitable for varying purposes depending on the kind of available data.
| PowerPoint PPT presentation | free to download
Dynamic Visualization of Transient Data Streams P. Wong, et al The Pacific Northwest National Laboratory Presented by John Sharko Visualization of Massive Datasets
| PowerPoint PPT presentation | free to download

This is a very big area, so talk will just give a flavor of the kinds of ... Visualization and animation seem naturals for illustrating concurrency ...
| PowerPoint PPT presentation | free to view

Basic visualization model (one user role): DATA. USER ... stem from basic' computer graphics libraries. graphic data types and drawing operations ...
| PowerPoint PPT presentation | free to view

Jedi Parallel Molecular Dynamics. ImmersaDesk 3D Collaborative Visualization ... and flexible event notification system that uses dynamic code generation ...
| PowerPoint PPT presentation | free to view
Our certified experts shortlisted and tested six Data Visualization Libraries in Python that you can try. We compiled our results to create the following list, taking into account the evolving needs of software development and different data ecosystems businesses may have.
| PowerPoint PPT presentation | free to download

Molecular Dynamics simulations Bert de Groot Max Planck institute for biophysical chemistry G ttingen, Germany Molecular Dynamics Simulations Non-bonded interactions ...
| PowerPoint PPT presentation | free to view

Data visualization transforms raw data into meaningful visual formats like charts, graphs, and dashboards, enabling businesses to identify trends, uncover insights, and make informed decisions. It simplifies complex datasets, enhances communication, and supports real-time analytics for better strategic planning. Tools like Power BI and Tableau make the process intuitive and impactful.
| PowerPoint PPT presentation | free to download
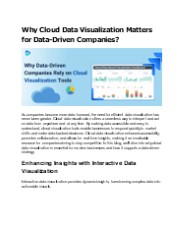
Cloud data visualization offers key benefits for growing businesses by providing real-time insights that support data-driven decisions. It enables companies to reduce data silos, improve collaboration, and leverage analytics for strategic growth, helping teams align with organizational goals and drive sustainable success.
| PowerPoint PPT presentation | free to download

Network Visualization Software a few examples Sarah Koo stats 319 - 2.8.11 Facebook5 Dataset Caltech (769 Nodes, 16656 Edges) Princeton (6596 Nodes, 293,320 ...
| PowerPoint PPT presentation | free to download

Crafting remarkable user experiences in the ever-advancing world of app development involves a blend of innovation and technology. One of the driving forces behind this evolution is the seamless integration of dynamic data visualization. At the forefront of this transformative approach stands React.js, a JavaScript library revered for its efficiency and component-based architecture. Beyond being a mere tool, React.js empowers us to reimagine and create visually captivating, interactive, and data-driven dashboards, reshaping the landscape of app development. Join us on this journey as we delve into the transformative potential of React.js in redefining user experiences through data visualization.
| PowerPoint PPT presentation | free to download

Title: THE DYNAMIC LAYER Last modified by: Jeremy Gibson Document presentation format: On-screen Show (4:3) Other titles: Arial Geneva Helvetica Wingdings Lucida ...
| PowerPoint PPT presentation | free to download

Data visualization transforms raw data into meaningful visual formats like charts, graphs, and dashboards, enabling businesses to identify trends, uncover insights, and make informed decisions. It simplifies complex datasets, enhances communication, and supports real-time analytics for better strategic planning.
| PowerPoint PPT presentation | free to download

This is a very big area, so talk will just give a flavor of the kinds of ... Visualization and animation seem naturals for illustrating concurrency ...
| PowerPoint PPT presentation | free to view

For non-local data, use Query Previews. Advanced Filtering and Searching Interfaces ... Dynamic display techniques. Get over novelty, instead integrate ' ...
| PowerPoint PPT presentation | free to view
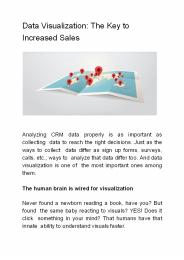
Data visualization with Dynamics CRM map plugin helps collect valuable insights faster and easily and strategize sales activities accordingly for better sales.
| PowerPoint PPT presentation | free to download

Software Visualization. A Task ... Match the Method to the Task ... Form, Method, Interaction, Effectiveness. Specification method, Interface, Presentation ...
| PowerPoint PPT presentation | free to download

This is a very big area, so talk will just give a flavor of the kinds of ... Visualization and animation seem naturals for illustrating concurrency ...
| PowerPoint PPT presentation | free to view
Microsoft Dynamics NAV is an intuitive, powerful and easy to use Business Management Solution with the comprehensive functionality of a leading ERP software as well as a modern user interface. Dynamics NAV allows you to manage end-to-end service lifecycle from Work Station, Web Browser and Smart device client. The intuitive user interface of NAV is tailored to the different roles in the company. Microsoft NAV automates and streamlines the processes of small and medium-sized businesses while connecting their sales, purchasing, operations, accounting, and stock management. With NAV, you can precisely plan the use of resources; minimize response time while maximizing the profitability of your organization.
| PowerPoint PPT presentation | free to download

Visual Queries for Finding Patterns in Time Series Data, Harry ... Careful interpolation, refrain from 'lying' Extended expolration. Comparing two rivers ...
| PowerPoint PPT presentation | free to download
MOVE-1: Progress Dynamics on Steroids Anthony D Swindells Engineering Fellow Agenda Dynamics Roadmap Overview Dynamics as a Trusted Authentication Domain ...
| PowerPoint PPT presentation | free to download

Information Visualization at UBC Tamara Munzner University of British Columbia
| PowerPoint PPT presentation | free to download
Thinking Interactively with Visualizations. Remco Chang. UNC Charlotte. Charlotte Visualization Center
| PowerPoint PPT presentation | free to download
Just like “a picture is worth a thousand words”, we, at Polycrayons, believe “a visual idea is worth a million imaginations”. A value that propels us to power imaginations with state-of-the-art, imaging solutions for 3D Architectural Rendering & 3d Visualisation
| PowerPoint PPT presentation | free to download

Small business or global enterprise, the financial health of your company means the difference between success and mere survival. If you've added employees, vendors, or customers, the system you started with might not be robust enough to manage cash flow or year-end reporting. If you've expanded your enterprise across multiple countries and many lines of business, your legacy system simply may not be able to manage the complexity of a global corporation. In any case, Microsoft Dynamics ERP gives companies like yours total control over their finances. What is financial management for businesses? Planning, allocating, and managing the financial resources of a business to ensure continuous working capital can include accounting, budgeting, risk management, procurement, and analysis and reporting. For details visit us at: http://www.microlabs.com.sg/what-is-microsoft-dynamics-nav/ Also get a demo that will acknowledge you how we will work for you.
| PowerPoint PPT presentation | free to download

Animation serves as a dynamic visual medium that simulates movement, thereby enriching narrative and communication. Within Microsoft PowerPoint, animation empowers users to incorporate visual effects into text and graphics, transforming presentations into captivating and interactive experiences for the audience. By integrating these effects, a presentation becomes more effective at capturing attention and sustaining viewer interest.The art of animation design necessitates meticulous consideration of visual components and their movements to ensure that messages are articulated clearly.
| PowerPoint PPT presentation | free to download

Answergen CRM Dashboard helps you transform your business CRM data into a meaningful visual insights to improve business process and decision making.
| PowerPoint PPT presentation | free to download

Need of Chat History -Importance of Establishing Common ground ... Transcribing the chat logs. Use of scrollbar to visualize them ...
| PowerPoint PPT presentation | free to view

Biomedical Computing and Visualization
| PowerPoint PPT presentation | free to view
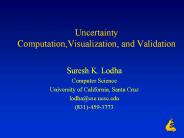
... used by the fusion community Probability Dempster-Shafer evidence theory Fuzzy sets and possibility theory Uncertainty representation in visualization ...
| PowerPoint PPT presentation | free to download

Biomedical Computing and Visualization
| PowerPoint PPT presentation | free to view
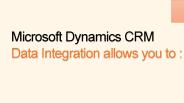
Answergen CRM Dashboard helps you transform your business CRM data into a meaningful visual insights to improve business process and decision making. Integrating Microsoft Dynamics CRM, Microsoft Dynamics CRM, CRM Integration
| PowerPoint PPT presentation | free to download

Geotagged videos are revolutionizing how industries collect and visualize project data. By embedding precise geographic coordinates into each frame, geotagged videos offer a dynamic, interactive way to understand and analyze projects across a wide range of fields.
| PowerPoint PPT presentation | free to download
Automatic Generation of Dynamics Models John W. Ratcliff Most Worshipful Senior Programmer Simutronics Corporation
| PowerPoint PPT presentation | free to download

A Visualization Framework For Earth Materials Studies. Bijaya Bahadur Karki ... Queen Bee (50.7 TFlops, 680 nodes. 2 quad-core processors) Visualization: Definition ...
| PowerPoint PPT presentation | free to view

Optimal-time Dynamic Mesh Refinement. Beno t Hudson, CMU. Joint work with Umut Acar, TTI-C ... Fixed quality bound: angle a. Output: Triangulation that is: ...
| PowerPoint PPT presentation | free to download

Create web applications with dynamic languages ... Silverlight. ASP.NET. Hosts. Visual Studio Integration. Summary. Dynamic Languages Initiative ...
| PowerPoint PPT presentation | free to download

Infographics are popular for their visual appeal and clear presentation of complex information. They are unique visual representations of data created with creativity and innovation. In education, infographics are used as tools to help students grasp information better. They differ from memes, which are humorous images or videos with text, as infographics focus on conveying information effectively. The theory behind infographics, known as infographic theory, includes principles and techniques for creating them, such as design elements, data visualization, and storytelling. Infographics are widely shared on social media and might include humor, but their main purpose is to convey information efficiently through visual means.
| PowerPoint PPT presentation | free to download

Visualization of NanoScale Structures
| PowerPoint PPT presentation | free to download