
Create A Histogram PowerPoint PPT Presentations
All Time
Recommended

When you want to provide information about the distribution of data - more specifically, the density of the underlying distribution of numerical data - a histogram may be the way to go.
| PowerPoint PPT presentation | free to download

This presentation educates you about Tableau - Histogram, Purpose of Tableau - Histogram, Creating a Histogram and Creating a Histogram with Dimension. For more topics stay tuned with Learnbay.
| PowerPoint PPT presentation | free to download

... data for the top ten player heights (in inches) by team during ... Using NBAPlayerHeights.xls, create a histogram with bin widths of 5 starting at 65 inches ...
| PowerPoint PPT presentation | free to download

draw bars using class boundaries and (relative) frequency. Histogram - example ... Draw a histogram to illustrate the above data. ...
| PowerPoint PPT presentation | free to view
... (low pass, high pass) non-linear filters (median) Noise Source of noise = CCD ... Neighborhood operations Original Low-pass Median Noise Reduction Low-pass ...
| PowerPoint PPT presentation | free to download
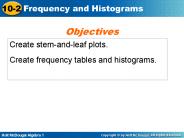
10-2 Frequency and Histograms Warm Up Lesson Presentation Lesson Quiz Holt Algebra 1 Create stem-and-leaf plots. Create frequency tables and histograms.
| PowerPoint PPT presentation | free to download

Be sure to clearly label axes with quantity measured and units (when appropriate) ... Ogive (Cumulative Frequency Polygon) Stem and Leaf Plot ...
| PowerPoint PPT presentation | free to view

... more books that are less than 16 years old than books that ... D) About of the books are less than 20 years old. Number of Books in the Library-by Age ...
| PowerPoint PPT presentation | free to view

Title: Exam I Histogram Author: Katherine Stevenson Last modified by: Katherine Stevenson Created Date: 10/2/2006 4:07:35 PM Document presentation format
| PowerPoint PPT presentation | free to view

Learn to format an SPSS histogram output into Word & in APA format ... Example of APA Formatted Histogram. with Normal Curve - as a Figure. Figure 4.2. ...
| PowerPoint PPT presentation | free to view

1. Histograms. A Graphical Method for Describing Quantitative Data. 2 ... the data by grouping similar data values into the same class (bin) in the graph. ...
| PowerPoint PPT presentation | free to view
Frequency and Histograms Warm Up Lesson Presentation Lesson Quiz Holt Algebra 1 Holt McDougal Algebra 1
| PowerPoint PPT presentation | free to download

Title: NNH Improving Performance of Nearest-Neighbor Searches using Histograms Author: Liang Jin, Nick Koudas, Chen Li Last modified by: Chen Li Created Date
| PowerPoint PPT presentation | free to download

Objectives stem-and-leaf plot frequency frequency table histogram cumulative frequency Vocabulary A stem-and-leaf plot arranges data by dividing each data value ...
| PowerPoint PPT presentation | free to download

Here I added other columns we will need to make our histograms and ... I click legend and unclick 'show label' box. Click next. I keep graph in the same sheet. ...
| PowerPoint PPT presentation | free to view

Frequency Distributions and Histograms Statistics: Section 2.2 Histograms Look like bar graphs but also have the following criteria: The bars have the same width and ...
| PowerPoint PPT presentation | free to view

We need to store some statistics of the database to estimate the selectivity ... Histograms are useful in estimating the selectivity of a query ...
| PowerPoint PPT presentation | free to view

Title: Basic Statistics for the Behavioral Sciences Author: Deborah J. Hendricks Last modified by: Windows User Created Date: 4/29/2002 1:59:42 AM
| PowerPoint PPT presentation | free to view
In this example, number of bins and weight are taken from defaults. see doxygen ... Set up the service using standard options // Choose Hbook or Root ...
| PowerPoint PPT presentation | free to download
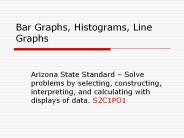
Bar Graphs, Histograms, Line Graphs Arizona State Standard Solve problems by selecting, constructing, interpreting, and calculating with displays of data.
| PowerPoint PPT presentation | free to download
Title: Slide 1 Author: HRW Last modified by: warren Created Date: 10/14/2002 6:20:28 PM Document presentation format: On-screen Show Company: Holt, Rinehart and Winston
| PowerPoint PPT presentation | free to download
This is a histogram of how many employees make a certain amount of money. Every time there is another employee in a salary category, the histogram gets taller.
| PowerPoint PPT presentation | free to download

| PowerPoint PPT presentation | free to view

Creating and Interpreting Stemplots Creating and Interpreting Stemplots In this presentation, you will learn about both basic stemplots as well as different advanced ...
| PowerPoint PPT presentation | free to view

Loginworks softwares discuss on graph create on android application. Graph View is a library for Android to programm for create flexible and good looking diagrams. It is easy to integrate and customize. Recently we have seen some View article like Increment Product View Overlay Veiw Image Slide View Discreate Scroll View Swipe View and many more you can get. But today i am going to share a Graph Library for creating zoomable and scrollable line and bar graphs. https://www.loginworks.com/blogs/how-to-create-graphs-in-android-application/
| PowerPoint PPT presentation | free to download

PRINT - Print a HTL histogram. LIST - List HTL histograms ... Interface to PAW (2) Proof of concept done. Integration of C in a FORTRAN application possible ...
| PowerPoint PPT presentation | free to download

They are no longer simply histogramming packages, but have added data analysis ... ntuples are trickier than histograms, as there are several different types ...
| PowerPoint PPT presentation | free to download

Auto focus. Enhancement: Histogram equalization ... Auto-Focus ... Blurred image can be detected by its histogram: Image mean is not affected by blurring. ...
| PowerPoint PPT presentation | free to view

ai. output. Polyelectrolyte conformation. Stretched under normal conditions ... New formulation of the problem: construct a 'flat' p. Implementation ...
| PowerPoint PPT presentation | free to download
Number of Rows on Non-Leaf-Level Pages Is Never Less Than Two ... Create Indexes on Foreign Keys. Create the Clustered Index Before Nonclustered Indexes ...
| PowerPoint PPT presentation | free to download

How many people attend NFL Super Bowl games? ... Given the following test scores, create a stem-and-leaf plot of the data: 78 65 94 80 83 56 73 ...
| PowerPoint PPT presentation | free to view

icon. horizontalAlignment. verticalAlignment. JTextField ... createMatteBorder(int top, int left, int bottom, int right, Icon tileIcon) ...
| PowerPoint PPT presentation | free to view

Too much junk in a web page. Goal: Extract only the content of a page ... Non-HTML or all content pages. approximation. ANNIE'08 Paper. Computing and ...
| PowerPoint PPT presentation | free to view


Create a Culture to Support Change
| PowerPoint PPT presentation | free to view

mrso.pbworks.com
| PowerPoint PPT presentation | free to download

Probability density definition and computing rules ... Shapes of quantile functions. p=seq(.01,.99,.01) q=qunif(p,-1,2) plot(p,q,type='l',xlab='probability p' ...
| PowerPoint PPT presentation | free to view

A Histogram is a variation of a bar chart in which data values are grouped ... standard deviation, class width, number of classes, skewness, and kurtosis. ...
| PowerPoint PPT presentation | free to view

after the sale. Timely and accurate. resolution of customer. concerns. Good warranty and ... Trucks. Breakdown. Flat Tire. Drivers. Don't know the route. Too ...
| PowerPoint PPT presentation | free to view

A Histogram Modification Framework and Its Application for Image Contrast Enhancement 9877003 Contrast enhancement plays a crucial role in image processing ...
| PowerPoint PPT presentation | free to view

ID and Young World The Intelligent Designer is the God who created the world recently Evidence for a young world connects the Designer with the Bible
| PowerPoint PPT presentation | free to view

Title: SUMMER SCHOOL ON IMAGE PROCESSING Author: Kuba Attila Last modified by: Giorgio De Nunzio Created Date: 7/9/2001 10:35:07 AM Document presentation format
| PowerPoint PPT presentation | free to view

Edit your videos like a pro by using these 7 best free video editing software.
| PowerPoint PPT presentation | free to download
Viswanath Poosala (Bell Laboratories) Presented by: Amrita Tamrakar. CSE 6392. 09-feb-2006 ... http://www.cs.uwaterloo.ca/~ashraf/pubs/vldb04autostats.pdf ...
| PowerPoint PPT presentation | free to download

Create a database of volcanoes including age, axes lengths, ... Area in red box is Volcan Laguna Verde in Chile. Color Image. Used to show better detail. ...
| PowerPoint PPT presentation | free to view

Creating Excellent Data Graphs for Everyday Evaluation Products ... Meet The Freaks. 23. EVALUATION, RESEARCH AND DEVELOPMENT UNIT THE UNIVERSITY OF ARIZONA ...
| PowerPoint PPT presentation | free to view

Working with K-12 Students to Create a Statistics Poster John Gabrosek and Neal Rogness Grand Valley State University ASA Meeting Within a Meeting Webinar
| PowerPoint PPT presentation | free to view

Middle States Commission on Higher Education. 3624 Market Street, ... Licensure & certification exam pass rates. Faculty workload. Student/faculty ratio ...
| PowerPoint PPT presentation | free to view

Why seed is cool... Warning: Blatant seed promotion ... For what I did: in the top trigger pages ../tools/freyas_standardchecks.html ...
| PowerPoint PPT presentation | free to download

Time-Series data is most common type used for presentations to management. The 'Standalone' Test: ... Example: time it takes to drive to work each day ...
| PowerPoint PPT presentation | free to view

Any relationships that you have created with GAD are remembered. ... Box & Whisker Plots. Dot Frequency Diagrams. Histograms. Back-to-back Histograms. Scattergraphs ...
| PowerPoint PPT presentation | free to view

Create a histogram to correct the selectivity calculation ... But presence of a histogram indicate skew unlikely one plan good for all bind values ...
| PowerPoint PPT presentation | free to download

Relate-Create-Donate: Educational strategies for the post ...
| PowerPoint PPT presentation | free to download

Developing visually compelling charts in PowerPoint is essential for the effective communication of data insights. To create a histogram, begin by selecting your dataset, navigating to the "Insert" tab, clicking on "Chart," and opting for "Histogram." For a box and whisker chart, follow the same procedure, but select "Box and Whisker" to effectively depict data distribution. To construct a box chart, start with a standard bar chart and modify it to represent your data in box format. Finally, for a waterfall chart, access the "Insert" tab, choose "Chart," and select "Waterfall" to illustrate the cumulative effects of both positive and negative values. By mastering these various chart types, you can significantly enhance the clarity and visual impact of your presentations.
| PowerPoint PPT presentation | free to download

Use color values (RGB) of the object to create a 3-D histogram ... each feature group, create an ellipse that ... PUMA 500 robotic arm (or EZ gripper) ...
| PowerPoint PPT presentation | free to download

To hide statement output: To display only execution plans: ... is FOR ALL COLUMNS SIZE AUTO, which enables automatic creation of histograms as needed. ...
| PowerPoint PPT presentation | free to view