
Big Data Visualization Techniques PowerPoint PPT Presentations
All Time
Recommended

By using traditional data analysis methods it takes time and effort to achieve the big data approach. To extract insights and information the unstructured data needs specialized data that models techniques, tools and systems which is required by the organizations. The right approach which applies math’s and statistical ideas and computer tools for big data are Data Science. It’s a dedicated field that gathers different areas like statistics, mathematics, intelligent data capture techniques, mining and programming to make and align big data for clever analysis to bring out the insights and information.
| PowerPoint PPT presentation | free to download

Slide 1. Visualization of scientific data under Linux - Techniques ... Present techniques for importing and ... Research Systems/Kodak - www.rsinc.com. Slide ...
| PowerPoint PPT presentation | free to download

Improving data visualizations is essential for effective communication and decision-making. First, prioritize clarity by selecting appropriate chart types that accurately represent the data. Second, utilize color strategically to highlight key information and ensure accessibility. Third, simplify visual elements to avoid clutter, focusing on essential data points. Fourth, incorporate interactive features to engage users and allow deeper exploration. Fifth, maintain consistency in design elements, such as fonts and styles, to enhance professionalism. Sixth, provide context through titles, labels, and annotations. Seventh, leverage storytelling techniques to convey a compelling narrative. Finally, solicit feedback to refine your visualizations continually and better meet audience needs.
| PowerPoint PPT presentation | free to download
Visualization and Data Mining techniques By- Group number- 14 Chidroop Madhavarapu(105644921) Deepanshu Sandhuria(105595184) Data Mining CSE 634
| PowerPoint PPT presentation | free to download

Data visualization is far beyond an art. With ever-evolving cognitive frameworks, multidimensional imaging, and intelligence, data visualization is opening gateways to visualize huge amounts of complex data. A modern substitute for visual communication, data visualization facilitates seamless decision-making for businesses.
| PowerPoint PPT presentation | free to download

Crafting remarkable user experiences in the ever-advancing world of app development involves a blend of innovation and technology. One of the driving forces behind this evolution is the seamless integration of dynamic data visualization. At the forefront of this transformative approach stands React.js, a JavaScript library revered for its efficiency and component-based architecture. Beyond being a mere tool, React.js empowers us to reimagine and create visually captivating, interactive, and data-driven dashboards, reshaping the landscape of app development. Join us on this journey as we delve into the transformative potential of React.js in redefining user experiences through data visualization.
| PowerPoint PPT presentation | free to download
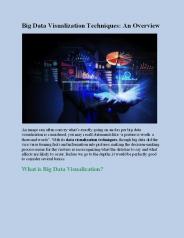
An image can often convey what’s exactly going on and as per big data visualization is considered, you may recall statements like “a picture is worth a thousand words”. With its data visualization techniques, though big data did the vice versa turning facts and information into pictures, making the decision-making process easier for the viewers as in recognizing what the data has to say and what effects are likely to occur.
| PowerPoint PPT presentation | free to download

Data Mining: Concepts and Techniques Getting to Know Your Data *
| PowerPoint PPT presentation | free to view

Data scraping, data extraction or web scraping is an automatic web method to fetch or do data collection from your websites. It converts unstructured data into structured one which can be a warehouse in the database.
| PowerPoint PPT presentation | free to download

Data Mining Lectures Lecture on EDA and Visualization Padhraic Smyth, UC Irvine ... Exploratory Data Analysis (EDA) get a general sense of the data. interactive ...
| PowerPoint PPT presentation | free to view

1. Data Representation and Approximation Techniques for Real-Time ... Destruct the structure before construction to maximize coherence. 57. The End. Thank You ...
| PowerPoint PPT presentation | free to view
This presentation will educate you about Data visulization, Why is data visualization important?, Benefits of data visualization, Benefits of data visualization and Some other popular techniques are as follows. for more topic stay tuned with Learnbay
| PowerPoint PPT presentation | free to download
Stop feeling overwhelmed by big data. Read the blog to find out which big data analysis techniques you might be missing.
| PowerPoint PPT presentation | free to download

If the field is a force field then the stream lines are called lines of force ... Animation - The best visual cue of depth and time is one of motion. ...
| PowerPoint PPT presentation | free to view

Data visualization is emerging as an important skill in data science and other respective data-driven industries, including education, finance, and healthcare. Since data professionals grapple with increasing volumes of complex and diverse data, data visualization evolves as an essential toolkit. Once considered a minor concept in data science, today, data visualization is a dynamic and fast-paced field, nurtured with multiple techniques, tools, theories, and contributions from other disciplines, such as neuroscience and psychology.
| PowerPoint PPT presentation | free to download

Elevating your consulting decks with 10 creative data visualization ideas can differentiate your work and leave a lasting impression on clients. By incorporating innovative and visually engaging charts, graphs, and infographics, you can effectively convey complex information in a clear and concise manner.
| PowerPoint PPT presentation | free to download

Real-time data visualization transforms supply chain management by providing real-time insights into logistics, inventory, and operations. Learn how this technology ensures efficiency, reduces disruptions, and improves decision-making in dynamic supply chain environments.
| PowerPoint PPT presentation | free to download
Visualization of Heterogeneous Data. Mike Cammarano. Xin (Luna) Dong. Bryan Chan. Jeff Klingner ... caption = This [[daguerreotype]] of Poe was taken in 1848 ...
| PowerPoint PPT presentation | free to download
CSE 634 Data Mining Techniques CLUSTERING Part 2( Group no: 1 ) By: Anushree Shibani Shivaprakash & Fatima Zarinni Spring 2006 Professor Anita Wasilewska
| PowerPoint PPT presentation | free to download

Visualization Techniques: Scalar Field
| PowerPoint PPT presentation | free to view

Data Mining: Concepts and Techniques Chapter 2 * Data Mining: Concepts and Techniques * ...
| PowerPoint PPT presentation | free to download
Palin Analytics is a great institute for online data analytics courses. Palin Analytics training institute in Gurgaon. We provide online Data analytics courses and certificate after course. You learn online data analytics course with Palin Analytics. We will learn data wrangling, data cleaning similarly to data visualization the usage of famous Python libraries like Numpy, Pandas, Matplotlib, and seaborn. 6 Months Complete Access of students. We provide a Certificate after course completion.
| PowerPoint PPT presentation | free to download
An Overview of Exploratory Data Visualization Dr. Matthew Ward Computer Science Department Worcester Polytechnic Institute From Data to Knowledge: Exploring ...
| PowerPoint PPT presentation | free to download
The world of data science is rapidly expanding. And python being a multi-paradigm is able to handle everything from website designing to running of embedded systems. With a gist of python anyone can do it
| PowerPoint PPT presentation | free to download

Introduction to Data Mining by Tan, Steinbach, Kumar Data Mining: Exploring Data What is data exploration? Key motivations of data exploration include Helping to ...
| PowerPoint PPT presentation | free to download

Data analysis is becoming a very important skill for many professionals, but there are many challenges in data analysis.
| PowerPoint PPT presentation | free to download

Data, Visualization and Collaboration Research
| PowerPoint PPT presentation | free to download

Visualization Techniques: Basic Scalar Field
| PowerPoint PPT presentation | free to view

Visualization Techniques: Volume Rendering Basics
| PowerPoint PPT presentation | free to view

From Sensors to Streams An Outline. Data Stream Overview. Data Stream Visualization . Temporal Heat Map. Data Stream Modeling. Extensible Markov Model
| PowerPoint PPT presentation | free to view
Approximation Techniques for Data Management Systems We are drowning in data but starved for knowledge John Naisbitt CS 186 Fall 2005 Traditional Query ...
| PowerPoint PPT presentation | free to download
Visualization Techniques for Terascale Particle Accelerator Simulations
| PowerPoint PPT presentation | free to download

The sales data can be augmented with the addition of virtual items. ... Spatial data: these elements correspond to a uniquely-defined location on earth. ...

Read this article today for Big Data Jobs and find data analyst and business analyst jobs available in Ahmedabad and Rajkot.
| PowerPoint PPT presentation | free to download

Intelligent Data Analysis (IDA) is one of the major issues in artificial intelligence and information. Intelligent data analysis discloses hidden facts that are not known previously and provides potentially important information or facts from large quantities of data (White, 2008). It also helps in making a decision. To Learn More: https://bit.ly/2vKwyYw Contact Us: UK NO: +44-1143520021 India No: +91-8754446690 Email: info@phdassistance.com Website Visit : https://www.phdassistance.com/
| PowerPoint PPT presentation | free to download

Vortex Visualization for Practical Engineering Applications. IEEE Visualization 2006 ... These techniques work on practical data: large, noisy, unstructured, ...
| PowerPoint PPT presentation | free to download

Vertical representation - allows for easy user interaction ... Louie, J. Q. and Kraay, T., 'Origami: A New Visualization Tool', KDD-99, San Diego, CA ...
| PowerPoint PPT presentation | free to view

Spatial data analysis tasks and techniques. Applying region growing approaches to segmentation of area data ... Tessellation of space. For example using grids ...
| PowerPoint PPT presentation | free to view

It is used to control the location of the view, set the projection model, set ... It uses an array (pointList) to store 3D location data of each point. ...
| PowerPoint PPT presentation | free to view

Virtual colonoscopy. Surgery and treatment planning. Diagnosis purposes ... Video courtesy: http://www.research.ibm.com/weather/DT.html. 16. Weather visualization ...
| PowerPoint PPT presentation | free to view

Visualization and Exploration of Massive Data Sets. UC Davis ... Develop visualization systems providing support for distributed collaborative data exploration ...
| PowerPoint PPT presentation | free to download

big data analytics courses in pune,business analytics courses in pune,data analytics courses in pune,analytics certification In pune,big data analytics course fees,analytics classes in pune,business analyst course in pune,SAS training in pune,python training in pune,R training in pune,online Big data analytics courses in pune

News. Reminder: no class next week. I'm at InfoVis/Vis in Baltimore. Overview. What is SciVis? ... Jean M. Favre. Glyphs (arrows) Techniques. Techniques ...
| PowerPoint PPT presentation | free to download

Special Topics In Database Sadra Abedinzadeh Ashkan Zarnani Farzad Peyravi Outline Motivation and General Description Data Warehousing: Basic Concepts and Techniques ...
| PowerPoint PPT presentation | free to view

Visualization of Spatial Data in Marine Biogeographic Information Systems ... Biogeographic information systems allow the exploration of spatial patterns of ...
| PowerPoint PPT presentation | free to download

Recent advances in immersive visualization of ocean data: Virtual Reality through the web on your laptop computer Albert J. Hermann Joint Institute for the Study of ...
| PowerPoint PPT presentation | free to download
Facing difficulties in deciphering your Google analytics data and reporting it to your clients? If yes, then don’t worry Google Data Studio has got you covered. Many marketers around face difficulties in accessing, understanding, and visualizing google analytics data. Because of that most of them fail to report back to their clients with authentic and reliable data. Read more on https://bit.ly/2Njq48k
| PowerPoint PPT presentation | free to download

Ordinal data. Data points are in a specific order, and the order denotes a meaning ... Ordinal. What is your house number? (Qualitative) - Why did you go there? ...
| PowerPoint PPT presentation | free to view

Apply service-oriented architecture to information visualization ... Service-oriented architecture (SoA) for information visualization. Technology ...
| PowerPoint PPT presentation | free to view

Key motivations of data exploration include. Helping to select the right tool for preprocessing or analysis ... Northeast National Technical Center, Chester, PA. ...

Data Mining: Concepts and Techniques Chapter 1 Introduction Chapter 1. Introduction Motivation: Why data mining? What is data mining?

Automated data collection tools, database systems, Web, ... R. O. Duda, P. E. Hart, and D. G. Stork, Pattern Classification, 2ed., Wiley-Interscience, 2000 ...

'Necessity is the mother of invention' Data mining Automated analysis of massive data sets ... Data mining is a major new challenge! ...

Data Mining Transparencies * Deviation Detection Can be performed using statistics and visualization techniques or as a by-product of data mining.
| PowerPoint PPT presentation | free to download
This certification program provides an overview of how Python and R programming can be employed in Data Mining of structured (RDBMS) and unstructured (Big Data) data. Comprehend the concepts of Data Preparation, Data Cleansing and Exploratory Data Analysis. Perform Text Mining to enable Customer Sentiment Analysis. Learn Machine learning and developing Machine Learning Algorithms for predictive modelling using Regression Analysis. Assimilate various black-box techniques like Neural Networks, SVM and present your findings with attractive Data Visualization techniques.
| PowerPoint PPT presentation | free to download

this certification program provides an overview of how Python and R programming can be employed in Data Mining of structured (RDBMS) and unstructured (Big Data) data. Comprehend the concepts of Data Preparation, Data Cleansing and Exploratory Data Analysis. Perform Text Mining to enable Customer Sentiment Analysis. Learn Machine learning and developing Machine Learning Algorithms for predictive modelling using Regression Analysis. Assimilate various black-box techniques like Neural Networks, SVM and present your findings with attractive Data Visualization techniques.
| PowerPoint PPT presentation | free to download