
CTC 261 Hydraulics Storm Drainage Systems - PowerPoint PPT Presentation
Title:
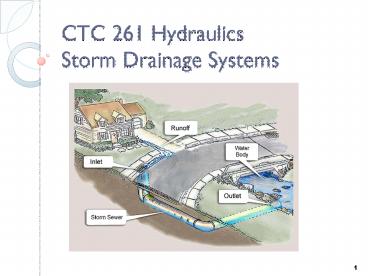
CTC 261 Hydraulics Storm Drainage Systems
Description:
Storm Drainage Systems * ... Design of Urban Highway Drainage * Two Concerns Preventing excess spread of water on the traveled way Design of curbs, ... – PowerPoint PPT presentation
Number of Views:685
Avg rating:3.0/5.0
Title: CTC 261 Hydraulics Storm Drainage Systems
1
CTC 261 HydraulicsStorm Drainage Systems
2
Objectives
- Ability to
- Understand the steps for storm drainage design
- Design riprap downstream of pipe outlet
3
References
- Design of Urban Highway Drainage
4
Two Concerns
- Preventing excess spread of water on the traveled
way - Design of curbs, gutters and inlets
- Protecting adjacent natural resources and
property - Design of outlets
5
Gutter Capacity
- Q is determined via rational method
- Slopes are based on the vertical alignment and
pavement cross slope (normal and superelevated
values) - Usually solving for width of flow in gutter and
checking it against criteria
6
Gutter Capacity
- Modified form of Mannings equation
- Mannings roughness coefficient
- Width of flow (or spread) in the gutter
- Gutter cross slope
- Gutter longitudinal slope
- Equation or nomograph
- Inlets placed where spread exceeds criteria
7
Gutter Capacity
- Q(0.376/n)Sx1.67S0.5T2.67
- Where
- Qflow rate (cms)
- Nmannings roughness coefficient
- Sxcross slope (m/m)------decimal
- Slongitudinal slope (m/m)-----decimal
- Twidth of flow or spread in the gutter (m)
8
(No Transcript)
9
Spread
- Interstates/freeways-should only encroach on
shoulder - For other road classifications, spread should not
encroach beyond ½ the width of the right most
travel lane - Puddle depth lt10 mm less than the curb height
- Can utilize parking lanes or shoulder for gutter
flow
10
Inlets
- Curb-opening inlet
- No grate (not hydraulically efficient rarely
used) - Gutter Inlet
- Grate only-used if no curb (common if no curb)
- Slotted (rarely used)
- Combination Inlet
- Used w/ curbs (common for curbed areas)
11
Grates
- Reticuline
- Rectangular
- Parallel bar
12
Interception Capacity
- Depends on geometry and characteristics of gutter
flow - Water not intercepted is called carryover, bypass
or runby - On-grade (percent efficiency)
- Sag location
- Acts as a weir for shallow depths and as an
orifice for deeper depths
13
Factors for Inlet Location
- Drainage areas/spread
- Maintenance
- Low points
- Up-grade of intersections, major driveways,
pedestrian crosswalks and cross slope reversals
to intercept flow
14
Storm Drainage System LayoutBasic Steps
- Mark the location of inlets needed w/o drainage
area consideration - Start at a high point and select a trial drainage
area - Determine spread and depth of water
- Determine intercepted and bypassed flow
- Adjust inlet locations if needed
- With bypass flow from upstream inlet, check the
next inlet
15
Design
- Software
- By hand w/ tables
- Hydrology
- Areas, runoff coefficients, Time of Conc,
Intensity - Hydraulics
- Pipe length/size/capacity/Velocity/Travel time in
pipe
16
Calculations
17
Closed Systems - Pipes
- Flow can be pressurized (full flow) or partial
flow (open channel) - Energy losses
- Pipe friction
- Junction losses
18
Closed Systems - Pipes
- 18 minimum
- Use grades paralleling the roadway (minimizes
excavation, sheeting backfill) - Min. velocity3 fps
- At manholes, line up the crowns (not the inverts)
- Never decrease the pipe sizes or velocities
- Use min. time of conc of 5 or 6 minutes
19
Example
20
Example
21
Summary Data for Each Inlet
Inlet Incr. DA (acres) Incr. Tc (min) Incr C
1 .07 6 0.95
2 .46 10 0.45
3 .52 10 0.48
4 .65 9 0.41
5 (MH) n/a n/a n/a
6 .10 6 0.95
7 .15 6 0.95
8 .70 14 0.38
22
Pipe Segment 1-2
- From IDF curve in Appendix C-3 tc6 min i5.5
in/hr - QCIA
- Q(0.95)(5.5)(0.07)
- Peak Q 0.37 cfs
23
Pipe Segment 2-3
24
Pipe Segment 2-3
- Find longest hydraulic path- see previous
- Path A 6 min0.1min6.1 minutes
- Travel time from table
- Path B 10 minute
- Using IDF and tc10 min, i4.3 inches/hr
- AreaInlet areas 12 .07.450.53 acres
25
Pipe Segment 2-3 (cont.)
- Find composite runoff coefficient
- (0.95.070.45.46)/0.530.52
- QCIA
- Q0.524.30.53
- Qp1.2 cfs
26
(No Transcript)
27
Pipe Segment 3-5
- Find longest hydraulic path- see ovrhd
- Path A dont consider
- Path B 10 min0.6 min10.6 minutes
- Path C 10 minutes
- Using IDF and tc10.6 min, i4.2 inches/hr
- AreaInlet areas 123 .07.450.52 1.05 acres
28
Pipe Segment 3-5 (cont.)
- Find composite runoff coefficient
- (0.95.070.45.460.480.52)/1.050.50
- QCIA
- Q0.504.21.05
- Qp2.2 cfs
29
Pipe Table (using App A charts)(25-yr storm
n0.015)
Pipe Seg Qp (cfs) Length (ft) Slope () Size (in) Capacity (full-cfs) Vel. (fps) Travel Time (min)
1-2 .37 30 2 12 4.4 3.4 0.15
2-3 1.2 200 3.25 12 5.8 5.6 0.6
3-5 2.2 25 2.5 12 5.0 6.0 0.1
30
Storm System Outfalls
31
Storm System Outfall
- Point where collected stormwater is discharged
from the system to the receiving body of water. - Outfall at stream bank (headwall in bank)
- Channel connecting outfall with stream (headwall
located outside of bank) - Outfall discharged onto stream overbank (similar
to 2 but no channel use for wetlands) - (See page 292 of your book)
32
Permissible Velocities (based on soil texture)
See Appendix A-2
- Values range from
- 2.5 fps for Sand/Sandy Loam (noncolloidal)
- To 6 fps for shale
- If velocities are outside range then erosion
control measures are warranted
33
Outfall Erosion Control
- Reduce Velocity
- Energy Dissipator
- Stilling Basin
- Riprap
- Erosion Control Mat
- Sod
- Gabion
34
Erosion Control-Riprap
- Various Design Methods/Standards
- Type of stone
- Size of stone
- Thickness of stone lining
- Length/width of apron
35
From your class book
36
Erosion Control-RiprapType of stone
- Hard
- Durable
- Angular (stones lock together)
37
Riprap-Basic Steps
- Determine velocity and compare to Appendix A-2
- Determine TW (use culvert)
- Determine type of stone
- Determine median stone size
- Determine apron length
- Determine apron width
- Provide plan/section
38
Erosion Control-RiprapSize of Stone
- D50 (0.02/TW)(Q/D0)4/3
- TW is Tailwater Depth (ft)
- D50 is Median Stone Size (ft)
- D0 is Maximum Pipe or Culvert Width (ft)
- Q is design discharge (cfs)
39
Erosion Control-RiprapLength of Apron
- TW gt ½ Do
- TW lt ½ Do
- See page 295 for equations
40
Erosion Control-RiprapWidth of Apron
- Channel Downstream
- Line bottom of channel and part of the side
slopes (1 above TW depth) - No Channel Downstream
- TW gt ½ Do
- TW lt ½ Do
- See page 295-296 for equations
Recommended
CrystalGraphics Presentations


