
Collaborative 3D and 4D Visualization in a Distributed Data System
1 / 35
Title:
Collaborative 3D and 4D Visualization in a Distributed Data System
Description:
Collaborative 3D and 4D Visualization in a Distributed Data System –
Number of Views:1773
Avg rating:3.0/5.0
Title: Collaborative 3D and 4D Visualization in a Distributed Data System
1
\
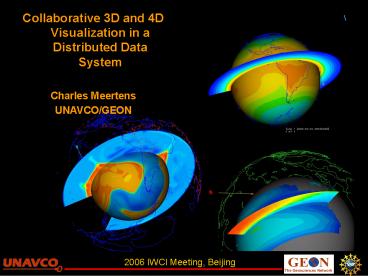
- Collaborative 3D and 4D Visualization in a
Distributed Data System - Charles Meertens
- UNAVCO/GEON
2
Outline
- GEON IT Approach -overview of 3D/4D Visualization
and backend architecture - Data access and distribution
- Visualization Elements and considerations for
3D/4D - GEON Integrative Data Viewer (GEON IDV)
- Future Developments Needed
3
- Acknowledgements
Stuart Wier and Greg Bensen, UNAVCO Don Murray
and Jeff McWhirter, Unidata NSF EAR and ATM
4
GEON Cyberinfrastructure (CI) Principles
GEON is based on a service-oriented architecture
(SOA) with support for intelligent search,
semantic data integration, visualization of 4D
scientific datasets, and access to high
performance computing platforms for data analysis
and model execution -- via the GEON Portal.
While focused on Earth Sciences, GEON
cyberinfrastructure is generic and broadly
applicable to a variety of other sciences and
other application domains.
5
GEON Overall Architecture
Data
Physical model
Modeling Environment
Model results
HPCC
6
GEON Visualization (and Data!) Steps
A number of steps were taken to engage community
input into the GEON development
process Visualization Workshop in San Diego,
2005 - Participants gained an exposure to a
number of visualization packages and related data
delivery methods ranging from custom powerful
integrated protocols like GeoFusion, to Open GIS
Consortium WMS and OPeNDAP. - An outcome of this
workshop was that major obstacles to effective
use of visualization in Cyberinfrastructure was
data interoperability, not lack of visualization
capability. It was recommended that netCDF be
used initially for GEON development. Data
workshop in Boulder, 2006 - Participants from
SDSC, Unidata, UNAVCO representing LEAD, GEON,
and CUASHI ITR projects met to discuss data
interoperability and find ways to collaborate on
CI related development efforts. This led to
implementation of netCDF into the GEON Grid
Portal.
7
GEON Visualization Workshop San Diego
Supercomputing Center Synthesis Center 1-2
March 2005 Meeting Summary C. Meertens, R.
Arrowsmith and C. Baru and IDV and Geofusion
(C.Stein) Demonstrations
8
GEON 4D Data Access and Visualization
- An ongoing GEON effort is to address 4D (xyzt)
representation of earth science datasets and
models in a grid computing environment. Current
desires and approaches include - Capable volume-time Integrative Visualization
tools Enhancing the Unidata IDV Java Application
for earth science data - 4D (and multi-parameter) Data Model Adopting
netCDF (used by IDV and soon by ESRI). Extensive
Common Data Model effort at Unidata - Data Discovery GeonSearch at the GEON Portal
- Data delivery html, OPeNDAP, OGC (WMS),
Interoperable - Automated Data/metadata registration currently
exploring OAI/ADN, DLESE Data Collection System
and webservice, THREDDS (Unidata) - Basically give me the specific types of data I
want, for only the specific time and volume I
specify, and in a way that I can find it quickly
and easily use it with any application I desire!
9
Data InteroperabilityWith data interoperability
Same data or model gt many usesbut until
recently same data graduate students and
programmers gt fewer uses!
Jules Verne Voyager Java Applet -gt GMT Server Versions Voyage to Earth Voyage to the Solar System Global Strain Rate Map (GSRM, Kreemer, et. al. 2003). Jules Verne Voyager, Jr. EarthScope Voyager, Jr. Javascript -gtdata server Shown are the velocities from the GSRM and planned EarthScope sites. Interactive Data Viewer (IDV) Global and Map versions Java Application -gt OPeNDAP Server Shown are S-wave anomaly isosurfaces of Ritzwoller, et. al. 2002 and the GSRM strain rates using the Global IDV. OPeNDAP Data Connector C application -gt OPeNDAP Server Shown is the S-wave velocity model converted to netCDF files. ArcVoyager, ArcMap ESRI Application DLESE/GEON, with UNAVCO contributions, is building an education module for the Earth Exploration Toolbook
And Google!
10
UNAVCO/ GEON Data Server and Visualization Access
UNAVCO/GEON Data Node OPeNDAP Server Example
Seismic Tomography in NetCDF format WMS
Server Example GPS Seamless Archive
Postgres/PostGIS Database
GEON IDV
THREDDS/OPeNDAP Catalog WMS Catalog HTML
File
Other distributed data servers
Local File
Under development registration of netCDF files
and OPeNDAP servers into the GEON Portal
embedded GEONSearch within the IDV
11
Why the GEON Integrated Data Viewer?
- GEON chose to extend the Unidata IDV as a 3D/4D
visualization for solid earth science
applications for a number of reasons. - First, the IDV was designed within a framework
of what is now called Cyberinfrastructure. - The IDV combines visualization with access to
distributed data systems and analysis
capabilities. - Powerful 3D-4D visualization
- Embedded mathematical capability using Jython
- Collaboration across internet
- Freely available
- Unidata and UNAVCO support and 10 person years of
development - -Scriptable for server-side automation at GEON
Portal - - JNLP capable for lauching with Java Webstart
12
UNAVCO/GEON IDV Development Some Samples
geon.unavco.org
Example Below Geodynamic and Tomographic models
on OPeNDAP Server. Visualization with IDV.
geon.unavco.org .Next some GEON IDV Samples
13
IDV for Mantle Geodynamics
Mantle Temperature
0.8 T (lower mantle) 0.5 T
(Upper mantle) Whole mantle Convection with
geologic plate motions over 120 million years.
Normalized temperature isosurfaces
shown. McNamara and Zhong (2004)
Lava Lamp analogy? Actually not, the physics is
different.
14
Enhancing the IDV for Global Tomography
Map version of the IDV showing the
Berkeley global shear wave tomography model on a
2 degree grid, Mégnin and Romanowicz, 2000.
Model data from this and other models of the
Reference Earth Model Project are directly
accessed from the UNAVCO/GEON DODS/OPeNDAP,
server
15
UNAVCO/GEON Enhancements to Unidatas IDV
- Earthquakes
- GPS vectors with error ellipses
- Earthquake focal mechanisms
- Anisotropy
- Customize interface for earth science users
- (Dr. Stuart Wier, UNAVCO)
Ability to show observations and models for your
domain is essential
16
Data Interoperability JV Voyager Images in the
IDV
17
About Data
Formats It is desirable to have data in a
common format, particularly when dealing with
very large 3D/4D models. Experience so far is
that almost no two formats we get from
investigators are the same in the scientific
world. Attributes Need at minimum basic
attributes (x,y,z,t, value(s), uncertainties).
Usually can get this. However, to facilitate
integration we likely need to employ conventions
and provide additional information. For example
tomography typically given as an anomaly. We need
a reference model to be reused and
integrated. Georeferencing Often models are
generated only with x,y,z andhe information to
go to latitude, longitude and depth is missing.
If lat, long provided, projections and datums may
needed as well. Boundaries vrs continuum There
are two fundamentally different type of volume
representations. 1) boundaries around volumes of
constant value (e.g. geologic units) and 2) other
gridded approximations of a continuum. Few
visualization programs handle both. Same notion
applies to time. Sampling Data is usually
irregularly spaced, models uniformly spaced.
18
Why netCDF?
- A binary standard was needed for 3D/4D data
format. NetCDF provides this as well as a data
delivery protocol and API that is used in the
IDV. - There are not a lot of options other than HDF in
the earth science scientific 3D/4D data/model
world. NetCDF is a mature, supported standard. - - NetCDF 4 is including major components of HDF5
into a common data model. - - NetCDF is used in a number of applications
including the Generic Mapping Tool (GMT though
in a limited way at the moment), Matlab, GRASS
3D. ESRI and Unidata are working on Arc support
for netCDF. - - NetCDF is a flexible container for data,
attributes and georeferencing information. - NetCDF is machine-independent
- - NetCDF heavily supported in the OPeNDAP data
distribution system.
Yellowstone (Smith and others) and the
geodynamics of the mantle (McNamara)
19
About Data Delivery UNAVCO/GEON PoP Server
Details Data, Models, Catalogs, Metadata
Data Access
http
- UNAVCO/GEON
- PoP Data Server
- 1D/2D/3D/4D
- Tomography
- GPS data/vectors
- Earthquakes
- Focal Mechanisms
- Strain rate
- Topography
- Image maps
- Geodynamics
- Faults
- Paleogeography
- Plus IDV visualization
- Bundles (.xidv files)
srb
ftp
gridftp
OGC
- OPeNDAP
- Data
- Servers
- netCDF
- Freeform
OPeNDAP
- Thredds
- Catalog elements
- Digital Library
- Metadata elements
- (via OAI or DLESE
- Webservice)
- WMS Catalog OGCWMS/WFS/WCS
Thredds Catalog
Dataset Catalogs and Metadata Access
OGC WMS/WCS/WFS
20
Visualization Elements
To be useful for you, a visualization tool must
suit your science domain. Sounds simple, but as
soon as you hit the wall and the tool does not
give you what you need you move on to the next.
This is a fact of life, however, so back to data
againwith interoperable data files and servers
using the next tool is not so painful. Next,
what are some earth science visualization
elements we need?
21
Visualization Elements - Points
- Locations (x,y,z) of a sample or event such as an
earthquake - Draw with dot, sphere, cross
- Locations and scalar parameter (x,y,z, value)
such as the magnitude of the earthquake. May want
to display uncertainty of location and/or value. - - Draw with dot, sphere, cross
- - Indicate value(s) by color, texture, size,
intensity - Location and vector (x,y,z, dx,dy,dz) such as GPS
velocity - - Draw with vector, but might need conical tip
for 3D - - Indicate value with length, vector thickness,
might use color - Location and tensor quantity (x,y,z, ) strain
and stress earthquake source parameter - - Draw with focal mechanisms anisotropy
flying erasers (not really figured out yet. - - Indicate value with color, diameter,
orientation of faults on focal sphere (really not
your typical visualization software graphic. - Boils down to being able to draw arbitrary
scaled, oriented, colored point symbols. Hard to
do with GIS.
22
Visualization Elements Point Data
Clockwise from top left Vectors, earthquakes,
focal mechanisms, and anisotropy
23
Visualization Elements Lines and Polygons
- Lines
- Locations are similar to points but need some
interpolation to connect the dots. Examples are
faults mapped on the surface, ray paths, sonde
tracks, etc. - Draw with a line or curve
- Lines plus scalar
- Draw with line colored with value, dash line,
vary thickness - Draw line with perpendicular variation such as a
seismic waveform plotted in two or three
dimensions. Might color in waveform. - Polygons
- Locations like lines, but enclosed regions of
constant value. Examples are geologic units of
constant age or lithology political boundaries.
Typical GIS shapefile feature. - Draw polygons with lines
- - Indicate value by area coloring or texture.
Could raise polygon off map like a histogram. May
dash polygon boundary or vary thickness.
24
Visualization Elements Lines and Polygons
- Lines
- Polygons
25
Visualization Elements - Surfaces
- Surfaces Maps with relief
- Often surfaces such as topographic contour maps
with relief are referred to as 3D, they are
actually 2.5 D surfaces. This is something you
quickly realize when, for example, you try to
grid tripod LiDAR data of an overhanging cliff.
Here you get full 3D with multiple values of Z
for each x,y. - Draw with lines, polygons (such as triangular
elements) - - Indicate value by coloring and texturing the
polygons can drape raster over surface, show
relief with perspective and illumination. May use
transparency.
26
Visualization Elements Volumes
- Volumes Full 3D objects
- Volumes can be rendered with isosurfaces
constructed of 3D polygons. The surface can be
colored, textured or made transparent to indicate
value or uncertainty. However, work still needs
to be done to effectively show uncertainty in 3D
volume space.
27
Visualization Elements Raster Files
- Raster images can come from photographic imagery,
multi-spectral scanning, interferometric SAR, and
derived products such as WMS and ArcGIS map
servers, gridded data, etc. A significant barrier
to use is geo referencing the image. Geotif
format allows for this in the raw image
specification, but is not widely used. WMS and
ArcIMS web mapping can also serve up this
information. Otherwise additional files or
metadata are needed. Rasters can be draped over
tomograpy. More recently photographic images have
been applied to full 3D surfaces from tripod
LiDAR scans. Visualization of raster files with
vertical orientation is rarely possible.
28
Some Ways to Probe data with visualization
Get a value of a 3D grid at a particular location
in space Get value and associated metadata of a
point such as an earthquake Generate graphs of
values along a line Generate two dimensional
contours along vertical/horizontal cross sections
of 3D grid Generate isosurfaces of constant
value (one at a time, if you wanted to generate
the equivalent of 3D contours you would need
transparency)
29
Visualization - Integration
- Putting it all together. The first step to true
integration is to remove the barriers to
accessing and importing the data and then
visualization of the data. Below are some
examples of multidimensional data displayed in
three dimensions with the GEON IDV.
Yellowstone (Smith and others) and the
geodynamics of the mantle (McNamara)
30
4D Visualization Images from GEON IDV
170 ma 90 ma
10 ma
Geodynamics, paleomagnetics, Paleogeography McNam
ara, Schettino and Scotese, Blakely
31
Integration with Visualization
- GEON is developing some very sophisticated
server-side integration methods at the GEON Grid
Portal. In addition to providing integrated views
of data, the GEON IDV also allow for some
advanced client-side integration. - The GEON IDV includes the capability to perform
preprogrammed and user input mathematical
operations using Jython. - Examples
- - Calculate the difference between two
model grids, even if the source grids have
different sampling in space and different
geographic projections. - - Calculate the divergence of a 3D vector
field - - Calculate the absolute velocity of a 3D
tomographic anomaly grid using a 1 D reference
earth model - - Difference a geodynamic model derived 3D
structure with observed tomographic grid
32
Working in the GEON Portal GEON Search
Search for Resources Current Types ASCII CUAHSI
Data GMT Raster GeoTiff Relational
Database Shapefile Tool WMS Service Web
Service NetCDF Search Constraints Metadata
Relation, Type, Subject, Keyword Spatial
Coverage Temporal Coverage Ontology/Concept
Relation
Example of unconstrained search response
33
Coming GEON Search in 4-Dimentions (need
depth)and previews from IDV and WMS Surface
geologic maps (GEON shapefile), WMS imagery,and
OPeNDAP Mantle Tomography
Credits (important!!) Where did it come from? Who
produced it? How good is it? Van der Lee and
Nolet NASA Blue Planet Geology GEON
34
What can still be done?
- At a minimum, we want to be able to ingest netCDF
1-4D files into the GEON Portal, find them using
GEON search, and retrieve files for use with the
IDV and other visualization tools. Ideally,
additional services volume data will be provided
such as currently supported for GIS. - Download netCDF file(s) after search
- - Generate a jnlp file associated with the netCDF
file that can be used to launch the IDV using
Java webstart - - Serve collection of netCDF files after search
using OPeNDAP/THREDDS as a proxy server (could be
distributed OPeNDAP servers) - - Integration with other data at GEON Portal
using server integration tools. - Add depth dimension to GEON query bounds
- - Add visualization to IDV for viewing 3D grids
(e.g. FEM). Add ability to load in isosurfaces
(vrml?). Allow for some simple model generation
using Jython in IDV, not just viewing. - - Upload IDV xidv xml files to Portal to share
knowledge (baby steps!) - - WMS GEON server-side slices of 3D volume grids
35
Thank-you!
IDV DEMO Tomorrow
Image source credits Mantle Tomography - Shapiro
and Ritzwoller Megnin and Romanowicz Geodynamics
Model - McNamara and Zhong Global Strain Rate Map
and Plate motions -Kreemer and Holt
Recommended
CrystalGraphics Presentations


