Digital Terrain Model - PowerPoint PPT Presentation
1 / 24
Title:
Digital Terrain Model
Description:
... a regular grid of squares or rectangles to fit over the randomly coordinated points and ... all 4 sides of the square and contour positions are computed ... – PowerPoint PPT presentation
Number of Views:1343
Avg rating:3.0/5.0
Title: Digital Terrain Model
1
Digital Terrain Model
- also known as
- digital ground model (DGM)
- digital height model (DHM)
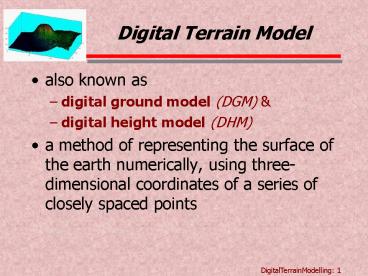
- a method of representing the surface of the earth
numerically, using three-dimensional coordinates
of a series of closely spaced points
2
Digital Terrain Model
- these coordinates are stored in the database of a
mapping system and are manipulated by the system
to produce a contoured plan of the ground - such a model is extremely useful in the design
and construction process, as it permits quick and
accurate determination of the coordinates and
elevation of any point.
3
Digital Terrain Model
- data for the model are acquired by a variety
methods, e.g. - radial positioning method
- aerial photogrammetry method or
- satellite positioning method
4
Modelling Techniques
- most mapping systems are capable of producing
plan view of the ground and of contouring the
plans - each package although has its own methodology but
the characteristics of each are fundamentally
very similar - 2 methods are commonly used
- regular grid method
- triangular irregular network (TIN)
5
Regular Grid Method
- on a point location survey, the points are
usually surveyed - along a pre-set grid or in a random fashion
6
Regular Grid Method
- for the latter case, the software will
- select a regular grid of squares or rectangles to
fit over the randomly coordinated points and - via interpolation, calculates the height of the
ground at each intersection - these grid intersections are called nodes
7
Regular Grid Method
- Interpolation process
- searches for the nearest 5 or 6 points to each
node and use their heights to compute a height
for the node - when the height of each node has been determined,
a linear interpolation is carried out along all 4
sides of the square and contour positions are
computed (indirect contouring)
8
Regular Grid Method
- ambiguities may occur in the linear interpolation
process - software solves the problem quite arbitrarily and
human intervention may sometimes be required
9
Triangulated Irregular Network
- a method adopted almost universally in DTM
systems - the coordinated points are used as the basis of a
triangular grid to form the surface of the ground
model
10
Triangulated Irregular Network
- the program uses the coordinated points to create
a set of triangles which are as near to
equilateral as possible in the given
circumstances - Delaunay Triangulation Method
11
Triangulated Irregular Network
- contour positions are determined automatically
using linear interpolation techniques - the program first calculates the entry points of
the contour lines (along the boundaries)
12
Triangulated Irregular Network
- the exit points are then calculated along the
internal sides of the triangles (entry points for
subsequent triangles) - finally the interpolated points are joined by
smooth curves to form the final contour positions
13
Triangulated Irregular Network
14
Plotting the Plan
- upon completion of either the regular grid method
or TIN, the plan is displayed on the monitor
(VDU) and the package awaits further instructions
from the user - if contour lines are not required, user can
simply quits the program OR ELSE the following
steps are followed
15
(1) Formation of boundaries and breaklines
- User must define boundaries and breaklines
- Boundary -
- a set of points forming the perimeter of the
database area - user is required to define these points or else
the program may create contour outside the
confines of the surveyed area.
16
(1) Formation of boundaries and breaklines (cont)
- Breakline -
- a line having a constant grade, e.g. surface of a
paved road or the top or bottom of a bank - they have to be defined to avoid making incorrect
interpolations across them, otherwise the contour
plan will not reflect these abrupt changes in
ground surface
17
(2) DTM Generation
- form the DTM
- software creates Delaunay triangulation and
interpolates the positions of the contour lines
along the triangle sides - user has no control over this operation
18
(3) Define Surface Plotting Parameters
- choose surface plotting parameters from a menu
which includes - range of heights in the database
- lowest and highest possible values of contour
lines using any selected contour interval
19
(3) Define Surface Plotting Parameters (cont)
- user may choose to plot any or all of the
following features - contours, triangles, boundaries or breaklines
- major and minor contour intervals
- straight or curved contour lines on the plans
20
(4) Plot Editor Option
- set the plot parameters
- scale of the plan
- origin of grid
- grid interval
- size of paper and layout drawing
- to the users requirements
21
(5) Plotting
- when satisfied that all the plotting parameters
have been correctly chosen, the user generates
the plot and the packages causes the plan to be
drawn ti these specifications either on the
screen or plotter
22
3D Digital Map
23
Digital Map
24
Alignments Profiles


