
Image Quantitation in Microarray Analysis - PowerPoint PPT Presentation
Title:
Image Quantitation in Microarray Analysis
Description:
Image Quantitation in Microarray Analysis More tomorrow... Microarray analysis Array construction, hybridisation, scanning Quantitation of fluorescence signals Data ... – PowerPoint PPT presentation
Number of Views:135
Avg rating:3.0/5.0
Title: Image Quantitation in Microarray Analysis
1
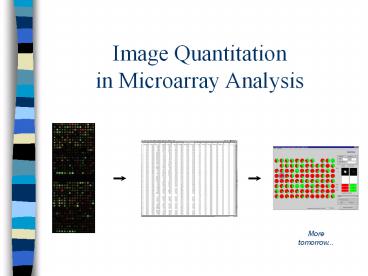
Image Quantitationin Microarray Analysis
Moretomorrow...
2
Microarray analysis
- Array construction, hybridisation, scanning
- Quantitation of fluorescence signals
- Data visualisation
- Meta-analysis (clustering)
- More visualisation
3
Technical
image from Jeremy Buhler
4
Experimental design
- Track whats on the chip
- which spot corresponds to which gene
- Duplicate experimental spots
- reproducibility
- Controls
- DNAs spotted on glass
- positive probe (induced or repressed)
- negative probe (bacterial genes on human chip)
- oligos on glass or synthesised on chip
(Affymetrix) - point mutants (hybridisation plus/minus)
5
Images from scanner
- Resolution
- standard 10?m currently, max 5?m
- 100?m spot on chip 10 pixels in diameter
- Image format
- TIFF (tagged image file format)
- can be compressed
- (eg. Lempel-Ziv-Welch 5x compression)
- 1cm x 1cm image at 16 bit 2Mb (uncompressed)
- other formats exist eg. SCN (used at Stanford
University) - Separate image for each fluorescent sample
- channel 1, channel 2, etc.
6
Images in analysis software
- Typical experiment
- normal state, Cy3-labelled sample (green)
- perturbed state, Cy5-labelled sample (red)
- hybridisation, then scanning
- overlay images ? pseudo-colour image
- qualitative representation of results
- Image spot colour Signal strength Gene
expression - yellow normal perturbed unchanged
- green normal gt perturbed repressed
- red normal lt perturbed induced
7
Quantitation process (1)
- Accurate representation of signal for each
spotand determine ratio channel1channel2 - Determine spot boundary
- construct grid (dimensions of array / spot size)
- iterative process to find spots
- Measure signal
- fluorescence
- 8 bit 256 shades
- 16 bit 65536 shades
- absolute output values vary from system to system
8
Quantitation process (2)
- Measure background
- local (usually best)
- selected region
- selected spots / probes from different species
- Quality control
- eg. fraction of pixels greater than background
(ScanAlyze) - flag aberrant spots
- Determine ratio of signal strengths for each
spot Ch1/Ch2 (Ch1I-Ch1B)/Ch2I-Ch2B)
9
Normalisation
- Eliminate systematic variation
- correct for
- dye incorporation
- print-tip effects
- hybridisation efficiencies
- etc.
- How?
- Use
STATISTICS!
10
Normalisation
- Simple example green vs red
- Normgreeni greeni
TotRed - TotRedB TotGreen - TotGreenB
11
Normalisation
- More complexe
- Within slide
- global (constant over the slide)
- spot intensity dependent (spot by spot)
- within print-tip group (group by group)
- scale (outlayers spread)
- Between slides
- paired-slides (dye swap)
- Multiple slides
- scale (slide outlayers spread)
12
Normalisation
13
Normalisation
- Example Within slide print-tip group scaling
- Before scaling
- After scaling
14
Normalisation references
statistics
- Normalization for cDNAmicroarray data
- Yang et al. (2001)
- In preparation
- Statistical methods for identifyingdifferentially
expressed genes in replicatedcDNA microarray
experiments - Dudoit et al. (2000)
- Technical report 578 Berkeley Statistics Dept.
- Both PDFs are available from the web site of the
course
15
Quantitation - problems
- Reference signal is close zero
- channels ratio (Ch1/Ch2) tends to infinity
- Non-uniform background
- mean background sometimes non-representative
- bright particles
- streaks on image
- safer to use median (middle value)
- less contribution by extreme values
16
Background problems
17
Background removal
18
Quantitation à la ScanAlyze
signal
background
19
ScanAlyze output
- CH1I ch1 intensity
- CH2I ch2 intensity
- SPIX number of pixels in spot
- CH1B median intensity of the local background
(recommended) - CH2B median intensity of the local background
(recommended) - CH1BA mean intensity of the local background
- CH2BA mean intensity of the local background
- BGPIX number of background pixels
- Thus to calculate channel ratios Ch1 CH1I -
CH1B - --- ----------- Ch2 CH2I - CH2B
- Quality control
- CH1GTB1 fraction of pixels in spot greater than
background (CH1B) - CH2GTB1 fraction of pixels in spot greater than
background (CH2B) - CH1GTB2 fraction of pixels in spot greater than
1.5 X background (CH1B) - CH2GTB2 fraction of pixels in spot greater than
1.5 X background (CH2B) - CH1EDGEA mean magnitude of the horizontal and
vertical Sobel edge vectors within spot 1 - CH2EDGEA mean magnitude of the horizontal and
vertical Sobel edge vectors within spot 2
20
(No Transcript)
21
Input files for Cluster
- Table tab delimited text, 1 line/gene, 1
column/experiment
- Minimal table
- Extended table
22
Prepare data for Cluster
- Exp1
- Exp2
. . .
- ExpN
23
Software packages - quantitation
- ScanAlyze
- by Michael Eisen (Stanford University)
- quantitation of images
- no data visualisation
- free from http//rana.lbl.gov/
- ImaGene
- BioDiscovery Inc.
- quantitation and some data visualisation
- demo from http//www.biodiscovery.com/
- plus many others - explore!
24
Making sense of raw data
- Difficult to see results in tabulated data
- Represent in graphical form
- Data visualisation examples from
ImaGene and others. . .
25
Data visualisation - scatter plot
26
Data visualisation - M vs A
27
Data visualisation - pie chart
28
- ScanAlyze
- quick demo
Recommended
CrystalGraphics Presentations


