
Jeopardy - PowerPoint PPT Presentation
1 / 51
Title:
Jeopardy
Description:
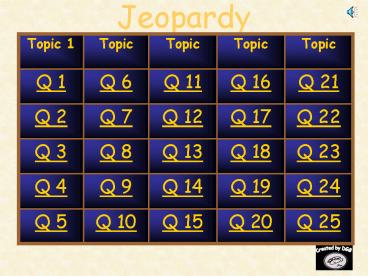
Jeopardy Topic Topic Topic Topic Topic 1 Q 21 Q 16 Q 11 Q 6 Q 1 Q 22 Q 17 Q 12 Q 7 Q 2 Q 23 Q 18 Q 13 Q 8 Q 3 Q 24 Q 19 Q 14 Q 9 Q 4 Q 25 Q 20 Q 15 Q 10 Q 5 QUESTION ... – PowerPoint PPT presentation
Number of Views:63
Avg rating:3.0/5.0
Title: Jeopardy
1
Jeopardy
Topic 1 Topic Topic Topic Topic
Q 1 Q 6 Q 11 Q 16 Q 21
Q 2 Q 7 Q 12 Q 17 Q 22
Q 3 Q 8 Q 13 Q 18 Q 23
Q 4 Q 9 Q 14 Q 19 Q 24
Q 5 Q 10 Q 15 Q 20 Q 25
2
QUESTION 1
3
ANSWER 1
- What is ?
4
QUESTION 2
5
ANSWER 2
- What is ?
6
QUESTION 3
The speed of sound in water is 1.46 X10³ meters
per second. The speed of sound in air is 3.31 X
102 meters per second. Sound travels _____ faster
in water than in air.
7
ANSWER 3
- What is 1.129 X 10³ m/s ?
8
QUESTION 4
_____ is the approximate value of
.
9
ANSWER 4
- What is 29.4 ?
10
QUESTION 5
_____ is the approximate length of a side of a
square that has an area of 221 square feet.
11
ANSWER 5
- What is 14.9 ft. ?
12
QUESTION 6
The ordered pairs shown form a quadratic pattern.
____ is the missing value of y.
13
ANSWER 6
- What is 26 ?
14
QUESTION 7
One equation is true for all the values in the
table.
15
ANSWER 7
- What is ?
16
QUESTION 8
17
ANSWER 8
- What is ?
18
QUESTION 9
19
ANSWER 9
- What is -20 ?
20
QUESTION 10
21
ANSWER 10
- What is 7 ?
22
QUESTION 11
Shown is the graph of the function
. ____ is the value of
.
23
ANSWER 11
- What is - 6 ?
24
QUESTION 12
The table gives the average per capita income, d,
in a region of the country as a function of the
unemployed, u. The table gives the average per
capita income, d, in the same region as a
function of the unemployed, u. One equation
represents this data algebraically.
25
ANSWER 12
- What is
- ?
26
QUESTION 13
One of these data sets represents a function.
27
ANSWER 13
- What is ?
28
QUESTION 14
The number of words Maria typed varied directly
with the amount of time she spent typing. If she
typed 275 words in 5 minutes, it take her ___
minutes to type 1,100 words.
29
ANSWER 14
- What is 20 minutes ?
30
QUESTION 15
The range of the function of x graphed at left is
___.
- all real numbers lt 3
- all real numbers lt -1
- all real numbers between -6 and -1
- all real numbers between -5 and 3
31
ANSWER 15
- What is D. all real numbers between -5 and 3
?
32
QUESTION 16
If y varies directly as x and the constant of
variation is - 2, one equation represents this
relationship.
33
ANSWER 16
- What is ?
34
QUESTION 17
One of the following is an equation for the
variation that includes all the data in the table.
35
ANSWER 17
- What is ?
36
QUESTION 18
Sally recorded her daily grades for one grading
period. 88, 88, 87, 92, 78, 88, 93, 100, 92, 90,
92, 92 Her mean grade was ____.
37
ANSWER 18
- What is 90 ?
38
QUESTION 19
Mr. Andrews made a box-and-whisker graph of the
quiz grades in his chemistry class. ____is the
median quiz grade for the class.
39
ANSWER 19
- What is 77 ?
40
QUESTION 20
This matrix shows the prices for some items at
three hamburger shops. Each of the three shops
honor their competitors coupons. One matrix
shows what the prices would be with a10-off
coupon.
41
ANSWER 20
- What is ?
42
QUESTION 21
is equivalent to
A.
43
ANSWER 21
- What is ?
44
QUESTION 22
45
ANSWER 22
- What is ?
46
QUESTION 23
The chart shows the ages in years of the girls on
two Olympic teams. The difference in the median
ages of the two teams is ____.
47
ANSWER 23
- What is 0 years ?
48
QUESTION 24
Joes New Car dealership lists the following
prices for this years models. 10,469,
12,895, 15,499, 17,999, 18,595, 21,245,
10,395, 14,985 The range in prices is ____.
49
ANSWER 24
- What is 10,850 ?
50
QUESTION 25
Using the data plotted on the scatterplot, one
equation most closely describes a line of best
fit for the data.
51
ANSWER 25
- What is ?
Recommended
CrystalGraphics Presentations


