
Natural Science is divided into 3 main branches: - PowerPoint PPT Presentation
1 / 62
Title:
Natural Science is divided into 3 main branches:
Description:
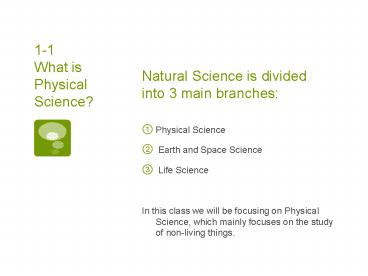
1-1 What is Physical Science? Natural Science is divided into 3 main branches: Physical Science Earth and Space Science Life Science In this class we will be focusing ... – PowerPoint PPT presentation
Number of Views:182
Avg rating:3.0/5.0
Title: Natural Science is divided into 3 main branches:
1
Natural Science is divided into 3 main branches
1-1What is Physical Science?
- Physical Science
- Earth and Space Science
- Life Science
- In this class we will be focusing on Physical
Science, which mainly focuses on the study of
non-living things.
2
So what is Physical Science?
- Physical Science is the study of matter, energy,
and the changes they undergo. - Matter is anything that has mass and occupies
space. - Energy is the ability to do work or cause change.
- Turn to page 8 in your textbooks.
- What are the 2 main branches of Physical Science?
3
Branches of Physical Science
- PHYSICS
- CHEMISTRY
- Study of matter, energy, motion, forces, and how
they interact - Learn about different forms of energy
- Apply the laws of physics that govern energy to
Earth, the solar system, and the universe beyond - Ever wonder how a laser works? A physicist knows!
- Study of the properties of matter and how matter
changes - Learn about the particles that make up matter and
properties of different forms of matter - Hydrogen alone is combustible. Oxygen alone is
combustible. When combined in the form of water,
H2O, they put out fire! Why?
4
Why Study Physical Science?
Because it is used everyday in the real
world! Who can think of some examples of when
Physical Science is used in real life?
- Consider these examples
- The water you shower with is heated by chemical
fuel or electricity - You use force to crush food when you eat
- The food you eat is converted into chemical
energy that your body uses to perform all of your
daily tasks - There are chemicals in toothpaste you use to
brush your teeth
5
BIG ideas of Physical Science
- force and energy
- the laws of conservation
- atoms, molecules, and the atomic theory
- The behavior of particles of matter in solids,
liquids, and gases
6
Skills Scientists Use
- Observing- Using one or more senses to gather
information. - 2 Types of observations
- 1) Qualitative Observations- Do not involve
numbers or measurements, That man is tall. - 2) Quantitative Observations- Involve
measurements, That man is 65 tall. - Inferring (or making an inference)- Based on your
observations or what you already know not always
correct. - Predicting- making forecast of what will happen
in the future based on past experience or
evidence
7
Observation Versus Inference!
OBSERVATION INFERENCE
The lady is wearing a ring on left hand ring finger. That lady is married.
The boy is carrying an umbrella. It must be raining outside.
The man has grey hair. That man is old.
8
Now you try! In your notes, classify the
following as observations or inferences
She must go to the beach a lot.
Her skin is very tan.
I smell funnel cake!
There may be an amusement park nearby.
9
How did you do?
She must go to the beach a lot.
Her skin is very tan.
I smell funnel cake!
There may be an amusement park nearby.
? INFERENCE
? OBSERVATION
? OBSERVATION
? INFERENCE
10
What is Scientific Inquiry?
1-2Scientific Inquiry
- Scientific Inquiry refers to the different ways
scientist study the natural world. It is the
ongoing process of discovery in Science. - In the process of scientific discovery,
scientists use curiosity, honesty,
open-mindedness, skepticism, and creativity. - Why are these good qualities for a scientist to
have?
- How do scientists investigate the natural world?
- What role do models, theories, and laws play in
science?
11
Process of Inquiry Includes
- Posing questions
- Developing hypotheses
- Designing experiments
- Collecting and interpreting data
- Drawing conclusions
- Communicating ideas and results
12
The Nature of Inquiry
Chapter 1 Introduction to Physical Science
- There is no set path that a scientific inquiry
must follow. Different scientists may choose
different paths when studying the same event.
The Scientific Method
- The scientific method is a more linear, organized
way to inquire about science. - It always starts with an observation.
- Copy the flow chart to the left, but add a bubble
to the top that says Make Observations.
13
Step 1 Observations Observations lead to a
question or problem Example You enter a dark
room and you observe that the lights are not
turning on. This should lead you to the Question
(Step 2) Why are the lights not working?
14
Step 3 Background Research Research will help
you form a hypothesis that makes sense. You could
use the internet, books, or even talk to
knowledgeable people to see what could be
possibly causing the lights to not turn
on. Example Possible explanations you come up
with could be that the light bulb burnt out, or
the electrical outlet is not working, or the
breaker needs flipped, etc Who can think of
some other possible explanations?
15
Step 4 Hypothesis Form a hypothesis (possible
explanation for observations) -Use the research
you just did! -Understand that your hypothesis is
only ONE possible explanation, and may not be
correct! Example You hypothesize that the light
bulb has burnt out.
16
Step 5 Test the Hypothesis with an
Experiment Collect data through observation or
measurement Qualitative characteristics (ex
red hair) Quantitative numbers (ex plant
height 32cm) Example Check other known-working
light bulbs in the lamp to see if the light will
turn on.
17
Controlled Experimentsonly 1 thing ( called a
variable) changes
- Variable that is deliberately changed
- manipulated variable (independent variable)
- What is the independent variable in this
experiment? (Hint What are we changing?) - Variable that is observed and changes in
response - responding variable (dependent variable)
- -What is the dependent variable in this
experiment? (Hint What is changing because of
our independent variable?)
THE LIGHT BULB!
WHETHER OR NOT THE LIGHT TURNS ON!
18
Controlled Experiments
- All other variables in the experiment are held
constant, which means they never change - controlled variable (constant variable)
- -What are some of the controlled variables in
this experiment? - Why would a scientist want to use a controlled
experiment?
THE LAMP, THE ROOM, THE ELECTICAL OUTLET
19
Step 6 (Part I) Record Analyze Data Organize
your data into charts and graphs so that it is
easier to recognize patterns Example
Light bulb 1 Light bulb 2 Light bulb 3 Light bulb 4
NOT WORKING NOT WORKING NOT WORKING NOT WORKING
20
Step 5 Draw Conclusions Decide if the evidence
supports or rejects your hypothesis. Example All
light bulbs in that lamp plugged into the same
outlet are not functioning, therefore I will
reject my initial hypothesis because it is
unlikely that all light bulbs are burnt
out. Rejecting your original hypothesis is valid
information because it helps you rule out
possible causes to the problem or question and
allows you to make a new hypothesis and start the
steps of the scientific method over again.
21
- Since our Hypothesis was not correct, we will go
back to step 4 and form another hypothesis that
we can test. ANY IDEAS??? - After we form our new hypothesis, we will go
back through the steps of the scientific method! - Once we find a hypothesis that is correct, we
have answered our question! - In larger experiments, scientists will write up
lab reports, repeat their experiments, publish
their results, or even branch out from the
experiment to test other ideas.
22
Why would scientists want to write lab reports
and/or publish their results?
So other scientists can learn from their data,
and to possibly receive credit for their work.
Why would scientists want to repeat their
experiments?
To make sure their results are accurate.
23
When does a hypothesis become a theory?
- When a hypothesis is tested and confirmed enough
times that it is unlikely to be proven wrong by
future tests - In science, the word theory applies to a
well-tested explanation that brings together a
lot of observations - A theory may be changed or replaced as new
evidence is discovered
24
What is a Law?
- A law is a statement that describes what
scientist expect to happen every time under a
particular set of conditions. - It describes an observed pattern without
attempting to explain it. - Laws have been verified over and over again.
- Example The Law of Gravity- states that all
objects in the universe attract each other.
Theories Versus Laws
- Laws DESCRIBE!
- Theories EXPLAIN!
25
Section 1-3Measurement
Chapter 1 Introduction to Physical Science
- Why do scientists use a standard measurement
system? - What are the SI units of measurement for length,
mass, volume, density, time, and temperature?
26
A Standard Measurement System
Chapter 1 Introduction to Physical Science
- Using SI as the standard system of measurement
allows scientists to compare data and communicate
with each other about their results. SI units are
based on multiples of 10. We will be using SI and
other metric units.
27
The Metric System
- The SI system is considered to be the modern
metric system. - It is considered a universal language for
scientists, doctors, the military, and most
countries.
- The US is one of the only countries not on the
metric system. - We use The English System which includes mph,
feet, pounds, gallons, Farenheit, etc..
Why do you think the US has not switched to the
Metric System?
28
Length
Chapter 1 Introduction to Physical Science
- The basic unit of length in SI is the meter (m).
- To measure something larger than a meter,
scientist may use kilometers (km), which means
one thousand.
- To measure something smaller than a meter,
scientists may use centimeters (cm), centi- means
one-hundredth, or millimeters (mm), milli- means
one-thousandth.
29
- Consider a ruler
- This ruler shows both Metric and English units
for measuring length - The numbers on the top are centimeters
- The tiny lines within each centimeter are
millimeters. - Notice there are 10 mm in 1 cm. COUNT THEM!
- How many mm are in 3 cm?
- The numbers on the bottom are inches
- Notice how much bigger 1 in is compared to 1 cm
- There are 2.54 cm in 1 in
- We will practice converting from Metric to Metric
and from Metric to English later!
30
WEIGHT vs MASS
- Weight
- Mass
- Your weight is a measure of the force of gravity
on you. - The force of gravity may be more or less on other
planets or moons than on Earth. - You would weigh about one-sixth of your Earth
weight on the moon. - The newton (N) is the SI unit, the pound (lb) is
the English unit.
- Mass is the measure of the amount of matter an
object contains. - Mass is not affected by gravity.
- If you travel to the moon, the amount of matter
in your body (your mass) will not change. - Scientists prefer to use mass rather than weight.
- SI unit of mass is the kilogram (kg), but we will
be using mostly grams (g) in this class. - WHY?
31
Volume
Chapter 1 Introduction to Physical Science
- Volume is the amount of space an object takes up.
- The SI unit of volume is the cubic meter (m3),
but we will often measure in Liters (L) or
millileters (mL).
32
Volume of a liquid
- Graduated cylinder
- mL
- Meniscus- curved surface at top of liquid, always
record measurements using bottom of meniscus
33
Volume of Rectangular Solid
Volume of Irregular solid
- Example- Cereal box
- Volume Length x Width x Height
- Remember to multiply numbers and units, so units
will be cubed - Example units cm3
- Example- Rock
- Submerge object in water in graduated cylinder
and measure the displacement of the water - Lets look at the example in your book on page 23
now
34
Density
- Two objects of the same size can have very
different masses. WHY??? - Because different materials have different
densities! - Density is mass per unit volume
- So Density Mass/ Volume
- SI unit of density is kg/m3, other common units
are g/cm3 and g/mL - Since density is made up of 2 measurements, it
always has 2 units
35
Calculating Density
Chapter 1 Introduction to Physical Science
- Suppose that a metal object has a mass of 57 g
and a volume of 21 cm3. Calculate its density.
- Read and Understand
- What information are you given?
- Mass of metal object 57 g
- Volume of metal object 21 cm3
36
Calculating Density
Chapter 1 Introduction to Physical Science
- Suppose that a metal object has a mass of 57 g
and a volume of 21 cm3. Calculate its density.
- Plan and Solve
- What quantity are you trying to calculate?
- The density of the metal object __
- What formula contains the given quantities and
the unknown quantity? - Density Mass/Volume
- Perform the calculation.
- Density Mass/Volume 57 g/21 cm3 2.7 g/cm3
37
Calculating Density
Chapter 1 Introduction to Physical Science
- Suppose that a metal object has a mass of 57 g
and a volume of 21 cm3. Calculate its density.
- Look Back and Check
- Does your answer make sense?
- The answer tells you that the metal object has a
density of 2.7 g/cm3. The answer makes sense
because it is the same as the density of a known
metalaluminum.
38
Calculating Density
Chapter 1 Introduction to Physical Science
- Practice Problem
- What is the density of a wood block with a mass
of 57 g and a volume of 125 cm3?
- 0.46 g/cm3
39
Density
Chapter 1 Introduction to Physical Science
- The density of a substance stays the same no
matter how large or small a sample of the
substance is. - So a gold earring and a gold necklace will both
have a density of 19.3 g/cm3
40
Sink or Float?
- Knowing an objects density allows you to predict
whether it will sink or float. - If the object is less dense than the liquid, it
will float. - If the object is more dense than the liquid, it
will sink.
Problem Water has a density of 1 g/cm3. Will
an object with a density of 0.7 g/cm3 float or
sink in water?
FLOAT!
41
Time
Chapter 1 Introduction to Physical Science
- The second (s) is the SI unit of time.
42
Temperature
Chapter 1 Introduction to Physical Science
- Scientists use the Celsius and Kelvin scales to
measure temperature. The kelvin (K) is the SI
unit of temperature.
43
Section 4Mathematics and Science
Chapter 1 Introduction to Physical Science
- What math skills do scientists use in collecting
data and making measurements?
44
Estimation
- An approximation of a number based on known/
reasonable information - Scientists cannot always obtain EXACT numbers
- Example measuring distances between stars
45
Accuracy and Reproducibility
- Accuracy
- Reproducibility
- How close a measurement is to the true value
- Example If you were playing darts, accurate
throws land close to the bulls-eye
- How close a group of measurements are to each
other - Example Reproducible throws land close to one
another
Scientists aim for both accuracy and
reproducibility in their measurements.
46
Significant Figures
Chapter 1 Introduction to Physical Science
- A measurement should contain only those numbers
that are significant.
47
Rules to Sig Figs
Significant figures in a measurement include
all of the digits that are known precisely plus
one last digit that is estimated. Non-zero
digits are always significant.
103.230002 All final zeros after the decimal
point are significant. 12.740
0.0420 Zeros between two other significant
digits are always significant. 10.0 2004
6.000 Zeros used only for spacing the
decimal point are not significant. 100
.00000233
- Here is a handout that discusses these rules..
- Lets look at it now!
48
Adding or Subtracting
- If you add or subtract, the answer is rounded to
the same number of decimal places as the
measurement with the least number of decimal
places. - Example
- 5.3 cm (1 decimal place)
- 21.94 cm (2 decimal places)
- 27.24 cm 27.2 cm (1 decimal place)
49
Multiplying and Dividing Measurements
Chapter 1 Introduction to Physical Science
- When you multiply or divide measurements, your
answers can have only the same number of
significant figures as the measurement with the
fewest significant figures. - 2.25 m
- X 3 m
- 6.75 m2 7 m2
50
You Try!!!How many sig figs do each of these
numbers have?
- Answers
- 4
- 2
- 5
- 6
- 6
- .004560
- 750
- 606,950
- 7,050.00
- 8.00003
51
Scientific Notation
- Scientific notation is the way that scientists
easily handle very large numbers or very small
numbers. - For example, instead of writing 0.0000000056, we
write 5.6 x 10⁻⁹ - How does this work?
- Lets take a look at your handout on Scientific
Notation and do some examples on the board!
52
Section 5Graphs in Science
Chapter 1 Introduction to Physical Science
- What type of data can line graphs display?
- How do you determine a line of best fit or the
slope of a graph? - Why are line graphs powerful tools in science?
53
Why use Graphs?
- Because of their visual nature, graphs can reveal
patterns or trends that words and data tables
cannot. - Scientists commonly use bar graphs, circle
graphs, and line graphs.
54
The Importance of Graphs
Chapter 1 Introduction to Physical Science
- Line graphs are used to display data to show how
one variable changes in response to another
variable. In this experiment, the responding
variable is the time it takes for the water to
boil. The manipulated variable is the volume of
water in the pot.
55
- Open your textbooks to page 37, and lets look at
the steps of plotting a line graph. - Draw the axes
- Label the axes
- Create a scale
- Plot the data
- Draw a line of best fit
- Add a title
(horizontal axis x-axis independent variable,
vertical axis y-axis dependent variable)
(focus on general pattern, not connecting dots)
(include both independent and dependent variables)
56
Why Draw a Line of Best Fit?
Chapter 1 Introduction to Physical Science
- A line of best fit emphasizes the overall trend
shown by all the data taken as a whole.
57
Slope
- The steepness of the graph line
Slope Rise y2 - y1 Run x2
- x1 Pick any two points on the line to use the
formula to find the slope of the line.
58
Slope
Chapter 1 Introduction to Physical Science
- The slope of a graph line tells you how much y
changes for every change in x.
Slope 25 km 10 km 15 km 0.5
km/min 50 min 20 min 30 min
59
Using Graphs to Identify Trends
Chapter 1 Introduction to Physical Science
- Line graphs are powerful tools in science
because they allow you to identify trends and
make predictions. - This graphs data forms a straight line, so it is
linear
60
Using Graphs to Identify Trends
Chapter 1 Introduction to Physical Science
- Not all line graphs will have data that fall on a
straight line. - This graph is nonlinear
61
Here are some more nonlinear graphs
62
No trend
Chapter 1 Introduction to Physical Science
- Even nonlinear graphs with no recognizable
pattern provides useful information to
scientists. - It most likely means that there is no
relationship between the two variables.