CYTOTOXICITY OF IMPLANTABLE GLUCOSE BIOSENSOR COMPONENTS - PowerPoint PPT Presentation
1 / 1
Title:
CYTOTOXICITY OF IMPLANTABLE GLUCOSE BIOSENSOR COMPONENTS
Description:
When the core is dissolved, an empty cage remains. These cages can be filled with glucose sensing chemistry then implanted in the skin. ... – PowerPoint PPT presentation
Number of Views:138
Avg rating:3.0/5.0
Title: CYTOTOXICITY OF IMPLANTABLE GLUCOSE BIOSENSOR COMPONENTS
1
CYTOTOXICITY OF IMPLANTABLE GLUCOSE BIOSENSOR
COMPONENTS Amy Collinsworth1, Varalakshmi
Wuyyuru2, Quincy Brown2, Michael J. McShane2,
David K. Mills1 1School of Biological Sciences,
2Institute for Micromanufacturing, Biomedical
Engineering, College of Engineering and Science,
Louisiana Tech University, Ruston, LA., 71272.
Introduction A serious issue in the treatment of
diabetes is strict monitoring of blood glucose
levels. Current methods require a painful
finger-stick to sample blood. Invasive procedures
have low patient compliance which leads to
serious complications. We are working to build a
minimally invasive glucose biosensor. Biosensors
will be constructed using layer-by-layer
self-assembly, where polyelectrolytes are layered
on a soluble core on the basis of their charge.
When the core is dissolved, an empty cage
remains. These cages can be filled with glucose
sensing chemistry then implanted in the skin. The
sensors will be interrogated from outside the
body to obtain blood glucose readings. The aim
of this study is to determine if individual
sensor components will cause a change in cell
function. Cell functionality will be evaluated by
quantifying type I collagen expression in Human
Dermal Fibroblasts (HDFs) after exposure to
biosensor components. Materials and Methods HDFs
were plated in 96 well dishes at a density of 200
cells per well and maintained in DMEM
supplemented with 10 fetal bovine serum (FBS)
and antibiotics-antimycotics. For all
experiments, triplicate cell cultures were used.
Subconfluent cell cultures were exposed to 4
different polyelectrolyte materials each in 7
concentrations ranging from 1mM to 1nM.
Polyelectrolytes were added directly to cell
culture media then added to each well. Control
cultures only received fresh complete media.
Cells were fixed in 4 paraformaldehyde every 6
hours for 24 hours. Cells were then stained
immunohistochemically using anti-type I collagen
antibodies. A Vector ABC Elite kit was used to
detect the antibody. TMB, a soluble colored
substrate, was used to allow absorbance readings
to be taken in a Tecan Sunrise microplate
reader. In addition to the quantitative work,
cells were stained immunochemically to provide
visual confirmation of type I collagen labeling.
Cells were grown on coverslips then stained using
the same antibody and detection system as above
except DAB was used as the substrate to create a
permanent brown reaction product. Cells were
counterstained in Vector Nuclear Fast Red.
Discussion Results were expected to correlate
with the previous results of a pilot study
performed with the same sensor components. In
this pilot study, cell morphology after exposure
to the sensor components was studied. Based on
those results, we expected to see a decrease in
collagen production as the concentration of
components and as the time of exposure increased.
Also, we expected to see control cultures with
the highest collagen production at the first time
point with increasing production with each
additional time point. Data from the current
study suggests that other methods should be
employed to determine cell functionality. In
many cases, control cultures demonstrated less
collagen production than those cultures exposed
to sensor components. A possible explanation for
this is the initial cell density was not equal
among all the wells. If this was the case, the
results from each well is not comparable because
they were not treated equally. Another
explanation is that after exposure to sensor
components, cells were left fragmented but still
attached to the dish. Cell fragments could have
trapped antibodies during staining, generating
false positive reactions. Future studies will
use light microscopy to count the number of cells
positive for collagen production instead of using
an absorbance reader to detect the level of
reaction. This will allow us to see the false
positive staining and omit it from the results.
This will be similar to the pictures shown here.
Cells will be grown on coverslips and stained
using immunocyto-chemistry. Using this method,
false positive results can be avoided and we can
gather more accurate data.
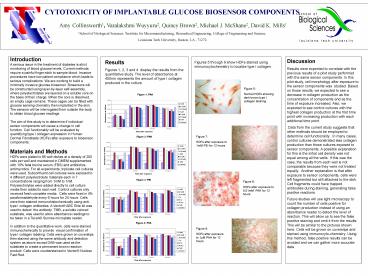
Results Figures 1, 2, 3 and 4 display the
results from the quantitative study. The level of
absorbance at 450nm represents the amount of type
I collagen produced in the culture.
Figures 5 through 9 show HDFs stained using
immunocytochemistry to localize type I collagen.
Figure 5 Normal HDFs showing dark brown type I
collagen staining.
Figure 7 HDFs after exposure to 1mM PEI for 12
hours
Figure 6 HDFs after exposure to 0.01mM PAH for
12 hours
Figure 8 HDFs after exposure to 1µM PAH for 12
hours


