
Perception, Cognition and the Visual - PowerPoint PPT Presentation
1 / 91
Title:
Perception, Cognition and the Visual
Description:
Musical terms. Legato (connected) Staccato (breaks) 2-Creating Continuity by bridging gaps ... What comedies have won awards? - Which funds underperformed the SP-500? ... – PowerPoint PPT presentation
Number of Views:82
Avg rating:3.0/5.0
Title: Perception, Cognition and the Visual
1
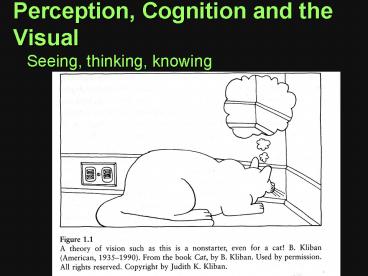
Perception, Cognition and the Visual
- Seeing, thinking, knowing
2
Perception cognition
3
Inner Display?
4
Perception Pre-attentive Perceptual/Cognitive
issues
- How do human visual systems analyzeimages?
- preattentively,without the need for focused
attention - Generally less than 200-250 msecs (eyemovements
take 200 msecs)
5
Preattentive Processes
- Grid stays while asterix disappears
6
Preattentive Processes
- Cognitive operations prior to focusing attention
7
Necker Cube 3 Ways
8
Completing Broken images
9
Visual Ambiguity
10
How Many threes?
- 12817687561389765469845069856049828267629809858458
22450985645894509845098094358590910302099059595957
72564675050678904567884578980982167765487636490856
0912949686
11
How many threes?
- 12817687561389765469845069856049828267629809858458
22450985645894509845098094358590910302099059595957
72564675050678904567884578980982167765487636490856
0912949686
12
Response Time where is the horizonatal bar?
13
Where is the letter L?
14
Orientation
15
Size/Scale
16
Colour (hue)
17
Hue where is the red circle? Not Usually
Pre-attentive
18
Hue shape
19
Region Search
Form boundary NOT identified pre-attentively Hue
variations interfere with form boundary identifica
tion
- Hue boundary identified
- pre-attentively
- Form variations do NOT
- interfere with hue
- boundary identification
20
Area Estimation
- Blue rectangles? Sloped rectangles?
21
Fill and Shape
22
Brightnesss
23
Shape
24
Luminance/Contrast
25
Color for Categories and Sequences
- Links to websites about color systems
- CIE, Munsell
26
Using Color--Varied Opnions, More later in the
course
- blue in large regions, not thin lines
- red and green in the center of thefield of view
(edges of retina not sensitiveto these) - black, white, yellow in periphery
- Color Brewer
- Pantone
27
Perceptual Tasks
- Target detection ( Is something there?)
- Boundary detection (Can the elements be
grouped?) - Counting ( How many elements of a certain type
arepresent?)
28
Perceptual Properties
- Luminance (measured) Brightness (perceived)
- Color
- sensory response to electromagnetic radiation--
wavelengths 0.4-0.7 micrometers) - Hue, value, saturation
- Texture
- Shape
- Sources Colin Ware Morgan Kaufmann Information
Visualization--Perception for Design
29
Optical Illusions and Programmed Variations
- Link
- Chernoff Faces link
30
Pre-attentive Perception, cognition
visualization
- Understanding of what is processed
pre-attentively - is probably the most important contribution that
vision science can make to data visualization. - BUT
- Humans do not perceive much unless we have
- at least some expectation and need to see it.
- - Colin Ware
31
Cognitive issues
- Visualization as a tool useful for
- aiding comprehension and understanding
- Seeing as thinking
- Visual Cognition Attention--Visual Cognition
Lab. U. Illinois
32
Time Maps Framing/Containing Memory
origin
prehistory
history
33
Time Frames in Collective Memory Studies
- Assumptions about mnemonic traces
- Cognitive vs. unconscious processes
- History vs. representations of the past
- mental structures
Salvador Dali, The Persistence of Memory, 1931
34
Processes Forms for Framing Memory in time
- Sociomental topography of how communities
remember the past - Unconventional approach to links between
conventional ideas of history
public/collecctive memory - mnemonic traditions
- recalling the past together synchronizing
attention on particular moments - social norms of remembering
- Mnemonic transitivity (allows memory to pass from
one person to another even when there is no
directe contact)
35
Triggers, memory retrieval (types of Mnemonic
devices)
- Words, facts, skills, events
- Ideals, goals, intentions, promises
- Feelings, states-of-mind, earlier selves etc
- Things, odours, ex. Madeleine (Proust,
Remembrance of things past, triggered by smell
and taste of Madeleines, a style of French
cupcake)
36
Time Maps the Social Shaping of Memory
- Questions of relevance
- Long and short term
- Eventful and uneventful periods
- Connections
- Discontinuities
37
Analyzing the Structures of Socio-Mental memory
traditions
- conventional ways of stringing memories together
into culturally-meaningful narratives - strategies to create the illusion of historical
continuity (bridges) - genealogical structures of ancestry descent
- watersheds that separate one period from the
next inflating mental divides - The social construction of beginnings (origin
myths and the legitimation of claims about the
past)
38
(1)Plotlines Narrative Forms
- Establish connections in narratives,
- scenarios, plotlines
- Mental historical outlooks,
- Selective use of history,
- Often anticipate future
- Progress narratives
39
Plotlines Narrative Forms
- Decline narratives
- Both imply single direction
40
Zigzag Narratives
- Conversion
- Recovery
- Rise fall
41
Evolutionary narratives
- Unilinear (deterministic)
- Multilinear
- (ex. Cladograms--branching)
42
Circles (Cycles),
- recurrence
43
Cycles (Rhymes)
44
Density Variations --Mountains and valleys
- eventful vs. uneventful moments in the past
- Unevenly distributed
45
Commemgram example
- Eventful times,
- Multiple pasts
46
Historical Phrasing in Narratives
- Musical terms
- Legato (connected)
- Staccato (breaks)
47
2-Creating Continuity by bridging gaps
- Linking noncontiguous points in time or place to
establish continuity - Same place
- Same things (relics memorabilia)
- Imitation of the past (ex. Courtroom etiquette
religious ritual) - same time (commemorative holidays,
reenactments, seasonal identity
48
Mnemonic pasting
49
Interconnectedness
- Genealogical Distance (consanguinity)
- Ancestral depth ( of generations)
50
Time and Social Distance
- Not just people
- Can be practices, things, events
51
Cousinhood Ancestral Depth
52
Monogenist Polygenist Models of Human Descent
- Socio-mnemonic dimensions of ancestry
53
Another look at Phylogeny
54
4-Discontinuities Mnemonic Cutting Shaping
Memory
- Conceptualizing Discontinuities (breaks)
55
Assimilation Difference
- Periods, epochs as mnemonic transformation of
historical continuum
56
History Prehistory--decapitation
57
History Prehistory in Mnemonic Traditions
- Example Pre-contact and Post contact history of
N. America
58
Lumping Splitting in Narratives
59
5-Beginnings and Claims based on the Past
60
Visualizations of Home/House. Child Katrina
Survivors
61
Recall House/Home (Katrina Victim)
62
House/Home
- House as roof
63
House?Home
- Sources Slide show of Katrina victims drawings
of house/home, Dewann, S. Using Crayons to
Exorcise Katrina, New York Times, Monday
September 17, 2007, Arts Section, B1,5.
64
Graphical visualization to support more efficient
task performance
- Allowing substitution of rapid perceptual
- influences for difficult logical inferences
- Reducing search for information required for task
completion - (Sometimes text is better, however)
65
Issues
- Cognitive Artifacts
- Matching Representation to Task
- Representations Aid Info Access and Computation
- Naturalness and Experiential Cognition
66
Cognitive Maps
- You have some existing internal model of the
- system, stops, how to get there
- glance at SFU map for help
- Refine your internal model, clarifying items and
extending it - Note differences between your map the official
one
67
Process Models Navigation in Visual systems
- -process by which a person looks at a graphic and
makes some use of it - substeps
- Can you describe process?
- Navigation in visual systems - Creation and
interpretation of an internal mental model
68
Information foraging
- Search for schema (representation)
- Problem solve to trade off features
- Search for a new schema that reducesproblem
- Package the patterns found in someoutput product
69
Navigation
70
Crystallization
71
Process
72
Browsing useful when
- Good underlying structure so that items close to
oneanother can be inferred to be similar - Users are unfamiliar with collection contents
- Users have limited understanding of how system
isorganized and prefer less cognitively loaded
methodof exploration - Users have difficulty verbalizing
underlyinginformation need - Information is easier to recognize than describe
73
If time
74
User Tasks in Visualization Environments--Eleven
basic actions
- identify, locate, distinguish,
categorize,cluster, distribution, rank, compare
withinrelations, compare between
relations,associate, correlate
75
Data Types and Tasks
76
Terminology
- Data case An entity in the data set
- Attribute A value measured for all datacases
- Aggregation function A function thatcreates a
numeric representation for a setof data cases
(eg, average, count, sum)
77
Steps in Creating Visualization
- 1. Retrieve ValueGeneral DescriptionGiven a
set of specific cases, find attributes ofthose
cases.Examples- What is the mileage per gallon
of the Audi TT?- How long is the movie Gone with
the Wind?
78
2. Filter
- General DescriptionGiven some concrete
conditions on attribute values,find data cases
satisfying those conditions.Examples- What
Kelloggns cereals have high fiber?- What
comedies have won awards?- Which funds
underperformed the SP-500?
79
3. Compute Derived Value
- General DescriptionGiven a set of data cases,
compute an aggregatenumeric representation of
those data cases.Examples- What is the gross
income of all stores combined?- How many
manufacturers of cars are there?- What is the
average calorie content of Post cereals?
80
4. Find Extremum
- General Description
- Find data cases possessing an extreme value of
anattribute over its range within the data
set.Examples- What is the car with the highest
MPG?- What director/film has won the most
awards?- What Robin Williams film has the most
recentrelease date?
81
5. Sort
- General DescriptionGiven a set of data cases,
rank them according tosome ordinal
metric.Examples- Order the cars by weight.-
Rank the cereals by calories.
82
6. Determine Range
- General DescriptionGiven a set of data cases
and an attribute of interest,find the span of
values within the set.Examples- What is the
range of film lengths?- What is the range of car
horsepowers?- What actresses are in the data set?
83
7. Characterize Distribution
- General DescriptionGiven a set of data cases
and a quantitative attribute ofinterest,
characterize the distribution of that
attributesvalues over the set.Examples- What
is the distribution of carbohydrates in
cereals?- What is the age distribution of
shoppers?
84
Find Anomalies
- General DescriptionIdentify any anomalies
within a given set of data caseswith respect to
a given relationship or expectation,e.g.
statistical outliers.Examples- Are there any
outliers in protein?- Are there exceptions to
the relationship betweenhorsepower and
acceleration?
85
9. Cluster
- General DescriptionGiven a set of data cases,
find clusters of similarattribute
values.Examples- Are there groups of cereals
w/ similar fat/calories/sugar?- Is there a
cluster of typical film lengths?
86
10. Correlate
- General DescriptionGiven a set of data cases
and two attributes, determineuseful
relationships between the values of those
attributes.Examples- Is there a correlation
between carbohydrates and fat?- Is there a
correlation between country of origin and MPG?-
Do different genders have a preferred payment
method?- Is there a trend of increasing film
length over the years?
87
Compound tasks
- Sort the cereal manufacturers by average
fatcontentCompute derived value Sort - Which actors have co-starred with
JuliaRoberts?Filter Retrieve value
88
What questions were left out?
- Basic mathWhich cereal has more sugar, Cheerios
or Special K?Compare the average MPG of
American and Japanese cars. - Uncertain criteriaDoes cereal (q, Y, Zj) sound
tasty?What are the characteristics of the most
valued customers? - Higher-level tasksHow do mutual funds get
rated?Are there car aspects that Toyota has
concentrated on? - More qualitative comparisonHow does the Toyota
RAV4 compare to the Honda CRV?What other
cereals are most similar to Trix?
89
Concerns
- InfoVis tools may have influencedstudents
questions - Graduate students as group being studiedHow
about professional analysts? - Subjective Not an exact science
90
Analytic gaps
- obstacles faced by visualizations in
facilitating higher-level analytic tasks, such as
decision making and learning.
91
(No Transcript)