CHAPTER 4 BIOLOGICAL COMMUNITIES AND SPECIES INTERACTION - PowerPoint PPT Presentation
1 / 25
Title:
CHAPTER 4 BIOLOGICAL COMMUNITIES AND SPECIES INTERACTION
Description:
Compare relative contributions of phosphorus and suspended sediment between ... UW Milwaukee Stream Ecology Group. School-based monitoring. USGS Monitoring Stations ... – PowerPoint PPT presentation
Number of Views:72
Avg rating:3.0/5.0
Title: CHAPTER 4 BIOLOGICAL COMMUNITIES AND SPECIES INTERACTION
1
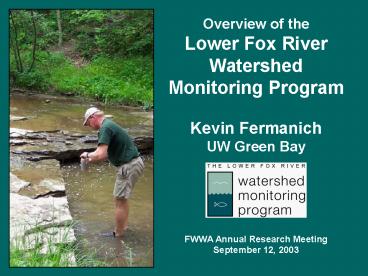
Overview of theLower Fox RiverWatershedMonitori
ng ProgramKevin FermanichUW Green BayFWWA
Annual Research MeetingSeptember 12, 2003
2
Overall Project Goal
- Initiate and establish a long-term monitoring
program that improves our ability to address
watershed quality issues (water quality, habitat,
etc.).
3
Primary Goal Water Quality and Load Monitoring
Components
- Compare relative contributions of phosphorus and
suspended sediment between watersheds and source
areas within the Lower Fox River subbasin and
UF04 in the Upper Fox subbasin.
4
Current Partners
- UWGB
- UW Milwaukee
- Arjo Wiggins Appleton Inc.
- USGS
- GBMSD
- Oneida Tribe
- 5 High Schools
- County conservation departments
5
Major Project Elements
- Continuous Monitoring
- USGS, UW Milwaukee, UWGB, Oneidas, GBMSD
- Stream ecosystem monitoring
- UW Milwaukee Stream Ecology Group
- School-based monitoring
6
USGS Monitoring Stations
- Installed directly through project funds
- 3 USGS water years
- Oct. 03 through Sept. 06
- 4 stations
- Duck Creek at CTH FF
- Baird Creek at Superior Road (I-43)
- Apple Creek at CTH U (Campground)
- Ashwaubenon Creek at Creamery Road
7
(No Transcript)
8
UW-Milwaukee Real-Time Monitoring
- YSI multi-parameter sondes
- Continuous stage height,
- turbidity,
- conductivity,
- temperature,
- pH,
- DO
- Fixed stations at 4 USGS sites, real-time
accessible - 4 remaining sondes installed elsewhere, locations
to be determined
9
Other USGS Stations
- Oneida Tribe/USGS
- Duck Creek at RR bridge in Howard
- GBMSD/USGS
- East River at Monroe Street
- (last operated 1985-86)
- USGS / DNR
- Bower Creek at CTH MM
- (last operated 91-94 96-97)
10
(No Transcript)
11
Methods / Parameters
- Daily stage / flow
- Low-flow / baseflow samples during winter
- Refrigerated samples collected during 10 runoff
events per year - Analysis by GBMSD
- Total P, Dissolved P, TSS (SSC)
- ?? Nitrate-Nitrite, Ammonia, and TKN
- Rain gauge at 4 USGS sites
- TSS (SSC) correlation with turbidity
- USGS will compute daily Total P and sed. loads,
and estimate dissolved P loads
12
Objectives Water Quality and Load Monitoring
- Better understand cause/effect through event and
continuous monitoring. - Compare flow, P, and SSC concentrations and loads
from different source areas (urban, urbanizing,
rural/ag). - Identify P sources at multiple spatial scales.
- Analyze trends for each site and relative changes
between sites with time. - Compare USGS load estimates to modeled loads for
same periods. - Assess validity of model.
13
Baird Creek Land Use
14
Ashwaubenon Creek Land Use
15
Duck Creek Land Use
16
Apple Creek Landuse
17
East River Landuse
18
Potential Supplementary Monitoring
- Baird Creek
- Compare rural and urbanizing conditions.
- Estimate urban loads from adjacent urban
tributary. - Urban BMP monitoring.
- Track DPTP from farm, channel, and stream using
targeted sampling throughout flow path. - Explore if turbidity can be used as a predictor
of sediment load and to improve sampling
efficiency.
19
School-Based Monitoring Program
- Four Watersheds / Five Schools
- Baird (Luxemburg-Casco / Green Bay West)
- Duck Creek (Green Bay Southwest)
- Apple Creek (Appleton East)
- Spring Brook UF04
- (Markesan)
20
School-Based Monitoring Program Goals
- Structured to provide meaningful data that
- Can be used to develop a picture of existing
conditions within and between watersheds.
(Baseline) - Provides a record of changing conditions over
time (Trends) - Can be used by students, teachers, scientists and
managers to answer questions about watershed
dynamics and integrity. (Cause and effect
relationships)
21
Program Approach
- Modeled after a successful program in Oregon
- Standardized equipment and methods
- Annual and periodic
training sessions - QA/QC Protocols
- Comparison to real-time data from UWM and USGS
- Equipment calibration and maintenance by staff
22
School-Based Parameters
- Physical Elements
- Temperature
- Turbidity (Clarity)
- Specific Conductance
- Streamflow
- Chemical Elements
- pH
- Dissolved Oxygen
- Soluble Reactive P
- Nitrate
- Ammonia
Habitat and Biotic Elements Habitat Macroinvertebr
ates Amphibians Birds
23
How will the data be shared?
- Student Watershed Symposium
- Project Website
- www.uwgb.edu/watershed (in development)
- Integration of overall project elements
(USGS, UWM, and school-based
program) - Online database
- Data review and quality criteria
- References and resources
24
Open Issues
- Bower Creek when is the right time to revisit?
- How can the monitoring data be fully utilized?
- How can the data best be used to reach least-cost
solutions to P sediment impacts within a
dynamic subbasin? - Where are the expertise and knowledge gaps?
- What grant opportunities should be pursued?
- UW Fox-Wolf Basin consortium?
25
Questions?
26
Objectives from Nutrient Grant RFP
- Identify and quantify P sources in the Fox-Wolf
Basin with the greatest potential to contribute
excess P - Identify and quantify land management practices
responsible for the greatest proportion of P
export - Determine how these practices and management
activities can be altered to reduce P export - Assess where limited resources for P remedial
practices should be targeted. - Determine the utility of the P risk index to
identify the P critical sources
areas in watersheds.


