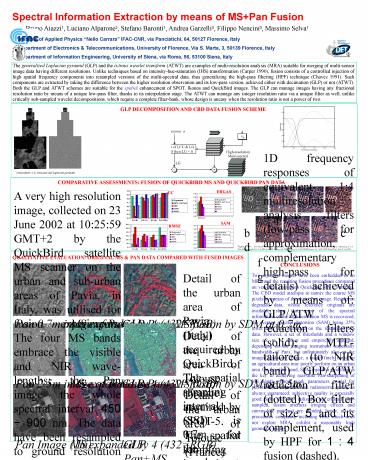
GLP DECOMPOSITION AND CBD DATA FUSION SCHEME - PowerPoint PPT Presentation
1 / 1
Title:
GLP DECOMPOSITION AND CBD DATA FUSION SCHEME
Description:
The GLP can manage images having any fractional resolution ratio by means of a ... A very high resolution image, collected on 23 June 2002 at 10:25:59 GMT 2 by the ... – PowerPoint PPT presentation
Number of Views:35
Avg rating:3.0/5.0
Title: GLP DECOMPOSITION AND CBD DATA FUSION SCHEME
1
Spectral Information Extraction by means of
MSPan Fusion
Bruno Aiazzi1, Luciano Alparone2, Stefano
Baronti1, Andrea Garzelli3, Filippo Nencini3,
Massimo Selva1
The generalized Laplacian pyramid (GLP) and the
à-trous wavelet transform (ATWT) are examples of
multi-resolution analysis (MRA) suitable for
merging of multi-sensor image data having
different resolutions. Unlike techniques based on
intensity-hue-saturation (IHS) transformation
(Carper 1990), fusion consists of a controlled
injection of high spatial frequency components
into resampled versions of the multi-spectral
data, thus generalizing the high-pass filtering
(HPF) technique (Chavez 1991). Such components
are extracted by taking the difference between
the higher resolution observation and its
low-pass version, achieved either with decimation
(GLP) or not (ATWT). Both the GLP and ATWT
schemes are suitable for the spatial enhancement
of SPOT, Ikonos and QuickBird images. The GLP can
manage images having any fractional resolution
ratio by means of a unique low-pass filter,
thanks to its interpolation stage. The ATWT can
manage any integer resolution ratio via a unique
filter as well, unlike critically sub-sampled
wavelet decompositions, which require a complete
filter-bank, whose design is uneasy when the
resolution ratio is not a power of two.
GLP DECOMPOSITION AND CBD DATA FUSION SCHEME
1D frequency responses of equivalent 14
multiresolution analysis filters (low-pass for
approximation, complementary high-pass for
details) achieved by means of GLP/ATW reduction
filters (solid) MTF-tailored (to NIR band)
GLP/ATW reduction filter (dotted). Box filter of
size 5 and its complement, used by HPF for 1 4
fusion (dashed).
Generalized (12) Gaussian and Laplacian pyramids
COMPARATIVE ASSESSMENTS FUSION OF QUICKBIRD MS
AND QUICKBIRD PAN DATA
A very high resolution image, collected on 23
June 2002 at 102559 GMT2 by the QuickBird
satellite MS scanner on the urban and sub-urban
areas of Pavia, in Italy, was utilised for fusion
experiments. The four MS bands embrace the
visible and NIR wave-lengths the Pan image the
whole spectral interval 450 900 nm. The data
have been resampled to ground resolution of 2.8 m
and 0.7 m GSD for MS and Pan, and packed in
16-bits. Firstly merge experiments have been
carried out on spatially degraded MS and Pan data
to allow quantitative scores to be measured
between fused products and true 2.8 m MS data.
Standard deviations, inter-band CCs, ERGAS and
SAM are plotted aside. The fusion methods
compared are HPF, IHS, and GLP/ATWT with either
spectral distortion minimising (SDM), or
context-based decision (CBD) injection model.
Also the case in which the MS data are resampled,
without injection of details, is reported.
ERGAS
CC
a b
c d
SAM
RMSE
e f
g
QUALITATIVE EVALUATION ORIGINAL MS PAN DATA
COMPARED WITH FUSED IMAGES
Detail of the urban area of Pavia (Italy)
acquired by QuickBird. The spatial sampling
interval (SSI) is 0.7m for the panchromatic (Pan)
image and 2.8m for the multispectral (MS)
components. The fused image has an SSI of 0.7m
and strongly preserves the spectral features of
the MS images both on urban and on vegetated
areas.
MS expanded by 4 (432RGB)
Pan 0.7m image of Pavia
GLP PanMS fusion by SDM at 0.7m
Detail of the urban area of Tolouse (France)
acquired by SPOT-5. The spatial sampling interval
(SSI) is 2.5m for the panchromatic (Pan) image
and 10m for the multispectral (MS) components.
The fused image has an SSI of 2.5m and preserves
the spectral characteristics of the MS images.
Spatial enhancement on urban areas is apparent.
Pan 2.5m image of Toulouse
GLP PanMS fusion by SDM at 2.5m
MS expanded by 4 (432RGB)
Detail of the urban area of Tolouse (France)
acquired by Ikonos. The spatial sampling interval
(SSI) is 1m for the panchromatic (Pan) image and
4m for the multispectral (MS) components. The
fused image has an SSI of 1m. Also at this
resolution the algorithm preserves the spectral
features of the MS images. The correction of the
aliasing phenomenon on sheds is impressive.
GLP PanMS fusion by CBD at 1m
Pan Image (1m)
MS expanded by 4 (432RGB)


