Real-time Environmental Coastal Observation Network (RECON) - PowerPoint PPT Presentation
1 / 18
Title:
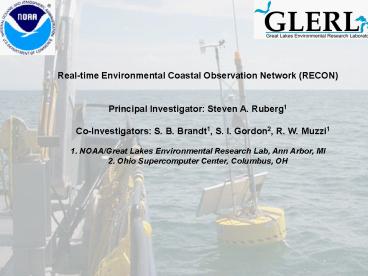
Real-time Environmental Coastal Observation Network (RECON)
Description:
Real-time Environmental Coastal Observation Network (RECON) Principal ... Lake Erie Yellow Perch Recruitment Model Development and Hypoxia Project ... – PowerPoint PPT presentation
Number of Views:19
Avg rating:3.0/5.0
Title: Real-time Environmental Coastal Observation Network (RECON)
1
- Real-time Environmental Coastal Observation
Network (RECON) - Principal Investigator Steven A. Ruberg1
- Co-Investigators S. B. Brandt1, S. I.
Gordon2, R. W. Muzzi1 - 1. NOAA/Great Lakes Environmental Research Lab,
Ann Arbor, MI - 2. Ohio Supercomputer Center, Columbus, OH
2
Real-time Environmental Coastal Observation
Network (RECON)
Portable Buoys Dan Frye, WHOI Universal
Interface Tom Austin, WHOI
- High bandwidth, wireless Ethernet-based system
- Real-time, secure data access
- Portable, low cost buoys and fixed platforms of
opportunity - Universal sensor interfaces
- Guest port access data delivered to a common
database or a single user - Developing partnerships with Federal, University,
and State components to operate and maintain
Observation sites
3
Development Process . Tested Prototype in
2002 . High Performance Computing Proposal in
2003 - 80K - constructed 2 buoys in
collaboration with
U Wisconsin - H. Bootsma . Integrated
Ocean Observing System Funding in 2005 - 365K -
2 buoys constructed by UM Space Research Lab,
completed drawing package, initiated DMAC
approach . NOAA/GLERL has contributed
approximately 250K during 2002 - 2006
4
RECON Applications
- Wireless systems deployed in coastal areas in
collaboration with universities,
AOML, Thunder Bay NMS, and NASA - Applications in 2006,7
- - Develop Real-Time Fisheries Acoustics
Capability (GOM, CREWS) - NWS Marine Wave Forecast Verification
- Beach Closure Forecast Model Development, NOAA
Oceans and Human Health - Thunder Bay National Marine Sanctuary -
Shipwreck Imagery, Met Data - - Lake Erie Yellow Perch Recruitment Model
Development and Hypoxia Project - University Benthic and Fisheries Studies (UT,
OSU) - Science Education (Monroe Public Schools hypoxia
project) - Public Information (explanation of H2S odor
associated with lake turnover in media)
5
- Research Rationale
- Provide real-time observations of chemical,
biological, and physical parameters to
scientists, managers, educators, and the public - Allow data collection during extreme weather
events - Facilitate modification of sampling parameters
in anticipation of episodic events - Trigger vessel-based sampling in response to
environmental events - - Improve system data collection reliability
- Support sensor and system development
6
RECON Buoy Operation
Buoy 3
Buoy 2
Meteorological Sensors
Buoy 1
Cleveland, OH
Temp, Chlorophyl, Turbidity, Oxygen
Profiles Hourly
21 m
Continuous . Waves and Currents . Cholorophyl,
Turbidity, Oxygen
7
System Block Diagram
8
- Wireless Internet Radio
- IEEE 802.11b Standard
- Access Point capable of many connections
- Reliable range tested to date 14 miles
- . Allows design of system based on currently
available networking hardware and open source
software - - meets requirement for high-bandwidth,
low-cost
9
Buoy and Fixed Observation Sites Bandwidth
Capacity
TBNMS 20 Mb/s
384 kb/s ISP
2 Mb/s UWM
384 kb/s NASA
2 Mb/s UT LEC
10
Networking Possibilities Western Lake Eire
IEEE 802.11b wireless hub configuration
- Common gateway
- Unique IP addresses
LEC Shore Station - address translation
11
Buoy General Specifications and Mooring
Buoyancy 545kg (1600lbs) Dia 1.22 m (4ft) Ht
0.61 m (2ft)
2 pt. Chain Mooring
12
Hub with Linux Buffer, Port Server, A/D
Interfaces - guest port concept
13
Network Components and Instrumentation
Vertical Profiler
UW Hub
Buoy Electronics
Webcam
Fiber Optic Cable
14
- Results to Date
- demonstrated the feasibility of wireless buoy
data transfer in array and relay - maintains connection in high waves, heavy rain,
snow - demonstrated ability to obtain high-bandwidth
data and provide instrument control - demonstrated streaming video in educational
live dives broadcasting environmental science
and archeological outreach programs from 10 miles
(at TBNMS) - developed a real-time web accessible data
display - In 2006,7
- develop real-time database management system
with the Ohio State Supercomputing Center - complete integration of vertical profiling
capability - continue development of fiber optic underwater
hub interface - add under-ice observation capability
15
Observations of Oxygen and Temperature
2005 Data
2003 Data
Comparison of oxygen decline in Erie central
basin. Thermocline in 2005 is slightly thicker
and lower in temperature than 2003 results.
Oxygen decline (less than 3mg/l) in 2005 occurs
later in the year falling at a slower rate.
16
Lake Erie Mixing Event
Lake mixing resulted in increased oxygen and
bottom temperatures also associated with
reported H2S odor along south shore of Lake Erie.
Wind Speed
Water Temperature
Wave Height
Oxygen at Bottom
Air Temperature
17
- Issues
- Submitted 2006 IOOS proposals addressing
- DMAC, system OM costs, ACT QA/QC of chemical
and biological sensors - NWS wave forecast verification
- Fisheries acoustics system integration
Not Funded
Currently working through NOAA tech transition
process
18
Questions?


