
Risk Issues - PowerPoint PPT Presentation
1 / 40
Title:
Risk Issues
Description:
20 cigarettes/day 1600. Being a coal miner 1100. Being 30lb(13.6kg) overweight 900 ... Stern discount rate less than market rate; a higher rate results in a higher ... – PowerPoint PPT presentation
Number of Views:52
Avg rating:3.0/5.0
Title: Risk Issues
1
Risk Issues
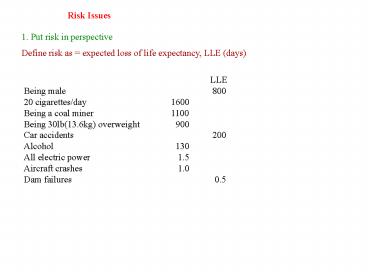
1. Put risk in perspective Define risk as
expected loss of life expectancy, LLE (days)
LLE Being male 800 20
cigarettes/day 1600 Being a coal
miner 1100 Being 30lb(13.6kg) overweight
900 Car accidents 200 Alcohol 130 All
electric power 1.5 Aircraft crashes
1.0 Dam failures 0.5
2
2. Radiation Doses (source Energy a
Guidebook, J.Ramage) Natural Sources Cosmic
rays 15 Food 18 (avoid brazil
nuts) Environmental 41 74
Man-made Sources Medical
25 Miscellaneous 0.6 Fall-out 0.3 Nuclear
power 0.4 26
Total in one year is in range 1-3 mSv,
milliSieverts (old unit mrem still used 1mSv
100 mrem) Higher where there is granite eg in
Cornwall 7mSv
3
3. Death due to major accidents
(1969-1986) Events Deaths per
Event Average/year Coal 62 10-434
200 Oil 63 5-500 75 Gas 24
6-452 80 Water 8 11-2500
200 Nuclear 1 50-6000
2-400 Total 158
600-1000 Chernobyl (1986) About fifty people
died as a direct result of the accident, most
from high radiation doses. The radioactivity was
carried great distances from the reactor. It is
possible amongst the 600,000 people who received
more significant radiation exposure that there
might be few percent increase in cancer
mortality. There has been an increase in thyroid
cancer (4000, most of whom were curable) amongst
children in the exposed areas of Ukraine,
Belarus and Russia. However, apart from this
increase in thyroid cancer there has been no
clear evidence from epidemiological studies for a
radiation-induced increase in cancer deaths or
mortality. Health, though was significantly
affected by the anxiety and the massive
relocation caused by the accident.
4
4. Psychological Dread Factor (Source Judged
frequencies of Lethal events S. Lichtenstein,
J.Exp.Psych. Human Learning and Memory, 1978,
4551)
106
car crashes
nuclear power
all diseases
pregnancy
Perceived number of deaths per year
104
strokes
botulism
102
smallpox vaccinations
102
104
106
100
Actual number of deaths per year
- Dread factor depends on
- observability
- controllability
- severity of accident
5
Common-mode Failure Important that two components
are independent. Eg i) if they are from same
batch using the same type of bad resistor or
ii) if two power supply lines ran through same
duct then likelihood that both would fail is
higher
6
b) Belt-and Braces philosophy Ability to
operate plant manually or by computer (note
computer control software needs to do exactly
what is expected of it - safety critical
software)
c) Inherently Safe Technology System goes
inert/benign when things go wrong (Chernobyl was
inherently unsafe - positive void coefficient)
d) Independent Regulation Government Agency with
power to close down plant if considered unsafe
(Nuclear Installations Inspectorate in UK) No
such organisation in former Soviet
Union/E.Europe Plant operators to be personally
responsible for all actions
7
e) Human Errors Analyse human behaviour under
stress Make repetitive operations interesting
(anti-boredom) Include scientists in control
room, ie not only engineers Encourage Best
Practice culture - a culture in which comments
on safety are not un-macho
f) Safety Cases All plant modifications to be
judged beforehand by formal safety case thorough
explanation of physical processes by experts in
field and challenged by independent experts
appointed by Government Agency, which judges
whether the safety case is convincing or not
8
- 6. Assessing Risks (Introduction to Energy,
E.S. Cassedy and P.Z. Grosssman) - a) Cost Benefit Analysis CBA
- Perfect safety unattainable
- Resources are finite
- b) Making a decision
- Identify problem and objectives
- Consider alternatives
- Determine consequences of each
- Analyse probability of each course
- Assign costs and benefits
- Select best
c) How are benefits to be analysed? CBA or Risk
CBA RCBA eg CBA of building a Highway C -
building it B- economic improvement RCBA- weighs
non-market values as well eg pollution, human
life Difficult to quantify but important to do so
9
US government widely relies on CBA However in
1975 a RCBA on oil tanker safety ignored the
costs of oil spills! In electricity generating
technologies projects must have an acceptable
level of risk - but this is vague
Revealed preference Takes view that there is a
level of acceptable risk and attempts to
determine it We drive, walk . all have
risks If new technology less risky, then we
should adopt it But are risks known? Has the need
for the new technology been assessed correctly?
Expressed preference Places evaluation with
population at risk However, how questions in a
survey are posed can bias the results Also people
often lack technical expertise and can they act
for future generations?
10
Ethical weighting A principle is adopted eg must
improve the lot of the worst off But would we
all agree with adopted principle(s) of
justice Who should decide?
i) Only scientists and engineers? But experts
have sometimes adopted dubious assumptions and
often disagree eg air quality standards
ii) A Science Court? Panel of scientists not
directly in field so no vested interests But are
scientists in other fields the best judges?
iii) A wider involvement Requires an enlightened
public Could end up with what side had the better
advertising campaign Can slow process of decision
considerably- while speed can lead to better
social equality
Currently we try and balance in a somewhat
haphazard way Efficiency and democracy,
government authority and individual rights and
expert opinion and public perception
11
Global Warming
Natural Effect Greenhouse Effect
- Thermal equilibrium _
- Incident solar power Radiated power from upper
atmosphere - P 4pR2sTe4
- Te 250 K (-23 C) _ l 8-12 mm (infrared)
- Natural greenhouse gases (GHG) in atmosphere (H2O
vapour, CO2) - absorb radiation emitted by Earth , resulting in
40C temperature rise - (average surface temperature 14 C)
Enhanced Greenhouse Effect increased levels of
GHGs raise effective height of radiative emission
and surface temperature rises
12
Population and Energy Consumption
- UN estimates population 9.1 billion (109) by 2050
- Demand expected to be about double by 2050 to 21
Gtoe. Caused by population and per capita
increase as economies and standard of living in
developing countries improve
- About 80 of primary energy from fossil fuels. To
keep CO2 emissions at same level requires 9 Gtoe
or 6 TWe of carbon-free energy - Reducing demand (30 from buildings), and
improving efficiency effective ways of reducing
CO2 emissions - Electricity 30 of global energy now predicted
to increase by 4 while total by 2. Improved
efficiency so fraction will be 50 of total.
- Need electricity but transport fuel is FOSSIL.
5 of CO2 emissions from cars in US. Globally
transport 25 of CO2 emissions. With improved
efficiency will also require 3 Gtoe
carbon-neutral fuel- biofuels and hydrogen- to
replace petrol and diesel- or use plug-in hybrids
(batteries)
13
Kyoto Protocol
Signed in 1997, came into effect 2005. Ratified
by over 160 countries but not by the US -concern
over effect on economy By 2012 Annex I
(Industrialised Countries) 5 GHG reduction cf
1990 EU 20 reduction by 2020 Three mechanisms
for reducing emissions or enhancing removals by
sinks Joint Implementation (JI) Carbon
Emission Reduction (CER) projects between Annex
I countries Clean Development Mechanism
(CDM) Annex 1 country investment in CER projects
in developing countries Emissions Trading
(ET) Trading of units- one tonne CO2(equiv) or
units obtained through JI or CDM projects
14
Fossil Fuel Reduction Policies
Emissions trading (ET) quantity fixed, price
adjusts - abatement where costs lowest, but
lower reductions in industrialised
countries - automatic transfers from rich
to poor - appeals to industry -
possibility of profit c.f. tax - caps are
easier to agree to internationally than taxes
but tight caps required to ensure
scarcity and high C price long term
trading period to reduce market risk
Carbon taxes (CT) price fixed, quantity
adjusts - broader scope e.g. can include
transportation - little transaction costs c.f.
ET - permanent incentive to reduce, to improve
energy efficiency and encourages low carbon
energy but uncertainty on tax required
for environment outcome can affect less
well off adversely
Regulations eg minimum standards for buildings
and appliances
15
Future Carbon EmissionsStabilization Wedges
2105 775 ppm 3.2 oC
2105 525 ppm 1.2 oC
16
Regional CO2 Emissions
17
Global Greenhouse Gas Emissions
N2O 8
14 CH4
59 CO2 Fossil Fuels
18 CO2 Land Use
1 F gases
Sulfate aerosols equivalent to -100 ppm CO2
18
CO2 Abatement Costs
Stern (2006) concludes that move from BAU to
500-550ppm by 2050 mean cost estimate 1 of GDP
19
Energy Consumption in the US
Mount Airy NC Library
- improving building design can reduce energy
consumption by 50-80 - embodied energy in buildings can also be reduced
20
Thermal Control(reducing heat loss can play a
major role in demand reduction)
BASF has produced Neopor a composite foam of
polystyrene and graphite to reduce thermal and
radiated heat loss.
Ground source heat pumps heating and cooling
21
Alternate Energy Sources
- Hydropower
- contributes 20 of worlds electricity (80 in
S.America) - about 70 of worlds hydropower potential is
unexploited - growth rate 2.5-3 per annum
- no atmospheric pollution
- large population displacement
- huge capital cost (30billion for Three Gorges
project - in China, 20GW)
- large loss of fresh water due to surface
evaporation - loss of natural irrigation, silting, wildlife
affected - dam bursts not infrequent large loss of life
- Cost 3 -14 euro/kWh
22
Alternate Energy Sources
- Wind Onshore 3TW using 4 of land with wind
speeds gt5.1 m/s. Fastest growing source 25
increase in capacity a year. 2 TW by 2050. Land
available for grazing or crops. - Wind intermittent but demand variable so if used
to meet base-load then saves fuel lt20 of total
then little extra spinning reserve (back-up
generation) needed.
Developing good energy storage would be very
useful environmental noise/ e.m. interference
in practice, many windy sites are too remote for
large exploitation environmental objections near
towns and beauty spots- needs changes in
planning. Energy density 5 MW/sq km cost 3-10
euro/kWh
23
Alternate Energy Sources
Solar 170,000 TW incident. At 10 conversion
efficiency 5-150 TW dependent on land area used.
Estimated (NREL) global 0.8 TW PV and 0.7 TW
concentrated solar power (CPS) by 2050. max in
summer / max demand in winter Energy/area
10-40 MW/sq km Cost PV 25-30 euro/kWh
CSP 10-15 euro/kWh
Biomass Global output 1 Gtoe biofuel, 1 TW
electricity by 2050. 300 Mha required size of
India- competition with food production- palm oil
Malaysia. Yield water supply limited.
Cellulosic feedstock eg switchgrass needed-
requires development of enzyme hydrolysis. Energy/
area 0.5 MW/sq km Cost 7-20 euro/kWh
24
Biofuels
Forest burned for palm oil plantation in Indonesia
25
Area to provide 20 UK electricity (10 GWe)
160 km 100 m
26
Proposed European Renewable Power Gridusing High
Voltage DC transmission
Trans- Mediterranean Renewable Energy Cooperation
(TREC)
27
Learning curves
Learning rate is percentage reduction in costs
for a doubling in cumulative production
Learning rate 22
Learning rate 15
Silicon PV Panels
Onshore Wind Turbines
28
Alternate Energy Sources
Tidal limited potential 0.1-1 TW. Developing
technology Energy/area 10 MW/sq km Cost 10
euro/kWh Wave Globally considerable potential
1-10 TW. Developing technology. Pelamis
type encouraging. 0.1 TW by
2050 Energy/area 30 MW/sq km Cost 6-10
euro/kWh
Geothermal 1 TW renewable potential. Several
TW for centuries. Developing technology 0.1
TW by 2050. Growing use of heat pumps in
buildings. Energy/area 25-50 MW/sq km
29
Wave Power
130 m long 750 kW 700 tonnes
Pelamis sea snake wave energy converter
First commercial wave farm off the coast
of Portugal
30 MW per square km
30
Carbon Capture and Nuclear Power
- Fossil fuel reserves greater than hundred years,
though not evenly distributed. Currently rapid
growth in coal particularly in China - Important to develop carbon capture and storage
- This would allow fossil fuels to provide
energy until alternative technologies developed - Cost 10 euro/kWh Resource 6 TW/150 y
- Nuclear power is an important source of
low-carbon - power. Public unease about its safety and
waste - disposal. Also concerns over nuclear
proliferation - and terrorist attack
- Fusion power could provide global energy
demand. - Cost 8 euro/kWh Resource 1 TW/100 y
31
Carbon Capture and Storage (CCS)
Developing technology by 2050 500 2000 GWe
32
(No Transcript)
33
Alternative Energy Sources
2ndgen
1stgen
Coal - 3 2TW/150 y 3
34
Support Mechanisms for Alternative Energy
- Feed in Tariffs guaranteed price to producer
- Renewable Obligation required quantity of
renewable energy from supplier
35
Economics of Climate Change
- Climate change effects and causes global very
long term and significant considerable
scientific, economic and political uncertainties - difficult ethical questions
- Costs dependent on stabilization level- risks
rise with increasing CO2e - ppm CO2e 3oC 4oC 5oC
- 450 18 3 1
- 500 69 27 7
- 750 99 82 47
- where is chance of that temperature rise
36
Stern estimated cost
Baseline climate1.5 4.5oC High Climate2.4
5.4oC, mode 3.5oC
Stern 5-20 loss in GDP per capita
37
Discounting
- Value of revenue in future is worth less than if
it were received today e.g. 100 invested at 5
interest would be worth 105 after 1 yr so 105
in a year from now would have a present value of
100
- Value of costs in the future is less than if they
were incurred today. Stern assumed future
generations equally important as present
generation and used a consumption discount rate
of 1.4 - Stern discount rate less than market rate a
higher rate results in a higher CO2e
stabilisation level as larger damages in the
future are discounted more
38
Strategy to reduce global warming
39
Geo-engineering
1 Effect on Plankton of increased iron in the
Pacific. 2 A large orbiting mirror. 3 A
reservoir covered with algae, and a crater lake
caused by a volcanic eruption. 4 An example of
cloud production, the Blur Building at the Swiss
Expo in 2002. NYT June 27, 2006
40
Predicted trajectory
16
525 ppm CO2
14
Stabilization wedge
efficiency
wind
12
solar
6000 GWe
Fossil fuel emissions (Gt C y -1)
10
biomass
nuclear hydro
8
CO2 capture
6
Proposed trajectory
475 ppm CO2
375 ppm CO2
4
Fusion
2
0
2060
2070
2000
2010
2020
2040
2050
2030
Year
Recommended
CrystalGraphics Presentations


