
Figure X: Comparison Selections for Preference vs. Belief Assessment
1 / 5
Title:
Figure X: Comparison Selections for Preference vs. Belief Assessment
Description:
Figure 1: Task 2 Predictions as a Function of Proxy's Task ... to New Stimulus as a Function of the Proxy's Past Preference Pattern and Reaction to New Stimulus ... –
Number of Views:30
Avg rating:3.0/5.0
Title: Figure X: Comparison Selections for Preference vs. Belief Assessment
1
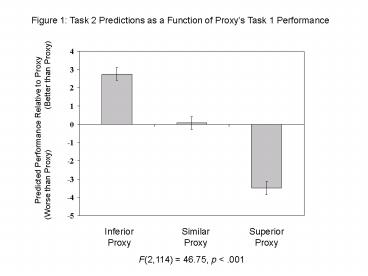
Figure 1 Task 2 Predictions as a Function of
Proxys Task 1 Performance
Predicted Performance Relative to Proxy (Worse
than Proxy) (Better than Proxy)
Inferior Proxy
Similar Proxy
Superior Proxy
F(2,114) 46.75, p lt .001
2
Figure 2 Task 2 Predictions as a Function of
Proxys Related Attributes
Predicted Performance Relative to Proxy (Worse
than Proxy) (Better than Proxy)
Similar Proxy
Superior Proxy
Proxy without Related Attributes
Inferior Proxy
F(3,149) 11.49, p lt .001
3
Figure 3 Task 2 Predictions as a Function of
Proxys Related Attributes Effort
Predicted Performance Relative to Proxy (Worse
than Proxy) (Better than Proxy)
Inferior Proxy
Similar No RA Proxy
Superior Proxy
F(2,104) 3.15, p lt .05
4
Figure 4 Comparison Selections for Preference
vs. Belief Assessment
Note Ratings were made on 7-point scales ranging
from 1 (no interest) to 7 (very interested).
5
Figure 5 Predicted Reaction to New Stimulus as a
Function of the Proxys Past Preference Pattern
and Reaction to New Stimulus
Note Ratings were made on 11-point scales
ranging from 1 (not at all) to 11 (enjoyed film
very much).
Recommended
CrystalGraphics Presentations


