Visualizing the Natural Environment - PowerPoint PPT Presentation
1 / 23
Title:
Visualizing the Natural Environment
Description:
Visualizing the Natural Environment – PowerPoint PPT presentation
Number of Views:220
Avg rating:3.0/5.0
Title: Visualizing the Natural Environment
1
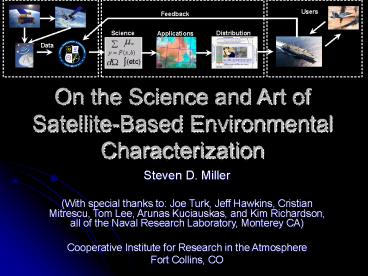
Users
Feedback
Distribution
Science
Applications
Data
(etc)
On the Science and Art of Satellite-Based
Environmental Characterization
Steven D. Miller (With special thanks to Joe
Turk, Jeff Hawkins, Cristian Mitrescu, Tom Lee,
Arunas Kuciauskas, and Kim Richardson, all of the
Naval Research Laboratory, Monterey
CA) Cooperative Institute for Research in the
Atmosphere Fort Collins, CO
2
Science in Art, Art in Science
2
3
Exploiting the Physics
E.g., a normalized difference dust index
NDDI (R853 R469) / (R853 R469)
Predicated on complex index of refraction
(ni) differences for silicates providing spectral
signature
? Substituting this information for the Red
color gun of a 3-color composite (previous
slide) will augment the blue absorbers (e.g.,
land/dust) while suppressing the gray reflectors
(e.g., clouds).
3
4
Dust Detection Over Land Water
The Art A graphical, salient depiction of dust
storms over the bright deserts.
The Applications Forecasting air quality,
determining visibility, outlining flight hazards.
4
5
A Quick Eye Exam
? A consideration for all graphical
communicationtry to avoid red green when
possibleunless using symbols/line-styles.
5
6
(It Also Works for Volcanic Ash)
? Volcanic glass particles melt/damage turbine
engines. Physics of detection for some ash plumes
are analogous to those exploited for the dust
enhancement.
6
7
Volcanic Ash Mt. Etna
7
8
Snow/Cloud Discrimination
The Art A means to discriminating between
high/low cloud and snow cover for complex scenes.
The Science Combine the conventional snow
detection techniques into a single mathematical
statement based on statistical thresholds. (Miller
, 2005 JAM)
The Applications Mapping snow cover at high
spatial resolution. Depicting snow cover in the
context of current meteorology. Short term
forecasting of fog formation. Aviation and
military applications (surface traffic).
8
9
Aircraft Contrail Detection
The Need Tool for visual identification of
contrail features in cloudy imagery.
Any contrails?
The Science 8.5/11/12 µm MODIS channels
sensitive to cloud phase (ice/liquid) and thin
cirrus.
The Applications For DoD surveillance of
access-denied flight space where not to fly.
Mankinds influences on climate.
9
10
Low Clouds at Night
The Need Identifying low clouds at night which
tend to blend in with the thermal background.
The Science The standard 11-3.9 um approach
(spectral emissivity differences), masking out
false alarms over the deserts. (Lee and Miller,
2003 AMS SatMet Long Beach)
The Applications Aircraft operations, monitoring
dense fog development over land for commerce.
10
11
Fire/Hot-Spot Detection
The Art Depicting active fires and hot-spots
over desert surface backgrounds.
The Science Use 3.9 channel to detect hot
spots, VIS/IR to filter clouds. Optimize
thresholds to local background.
The Applications Air quality forecasting,
alerts for fire development in remote areas.
11
12
Data Blends
12
13
Hurricane Katrina in GeoColor
GOES-12 Aug 27 0015Z Aug 29 1815Z
13
14
Tales from the Dark Side
- Reflection-based features
Emission-based features
14
15
As the Moon Turns
20041215 (0.24 full moon)
Phases Eccentricities Librations, Oh My!
15
16
TC Position Fixing at Night
DMSP/OLS 8/30/2004 0504 UTC 11.0 µm IR Window
- Exposed low-level circulation occurs when storms
enter a high vertical shear environment
Eastern Pacific
Georgette
20 N
- Decoupling of the upper and lower level cloud
fields
- Displacements between upper and lower level
centers can exceed 100 km in some cases
15 N
125 W
120 W
Avoiding the Sunrise Surprise
16
17
Dust Plumes at Night
Nighttime IR Only
Daytime MODIS VIS IR
20 km/hr
3 March 2004, 2017 GMT
3 March 2004, 1110 GMT
? Tracking dust plumes at night is incredibly
difficult with conventional infrared channels due
to the inherently weak signal and the confusion
brought on by nocturnal temperature inversions.
17
18
Snow Cover at Night
Texas
500 km
? Combining moonlight with conventional nighttime
satellite channels helps to identify new
features via process of elimination
18
19
Terrestrial Light Monitoring
New Orleans
Yellow No Change Red Lights Out Green
New Lights
Courtesy C. Elvidge, NOAA/NGDC
? Using reference images helps us visualize
change in the scene
19
20
Active Fires at Night
10/26/2003 0424Z DMSP F15
Fires City Lights
? Active fires product smoke at a different rate
than smoldering fires. This technique provides a
new way to differentiate between the two.
20
21
Truth Being Stranger than Fiction
- The vast glowing oceans of maritime folklore are
a real phenomenon thought to be caused by
luminous bacteria population explosions.
- Recent findings suggest that NPOESS/VIIRS may be
able to detect them from space
- The NPOESS/VIIRS day/night band will provide
improved low-light nighttime visible obs.
21
22
Some Soap Box Material
- Satellite imagery can be used both as an
educational and operational tool to visualize
complex physics/processes.
- Many frontiers of science reside in the first
decimal of interdisciplinary problems.
- We arent furthering the science if we cannot
communicate it effectively.
- If you cant explain what you do to Grandma then
maybe you dont truly understand it yourself.
22
23
Conclusion
- There are many ways to communicate information.
- Operational users do not have much time to
digest/process it.
- Complicated algorithms can be boiled down to
concise graphics.
A Picture is Worth a Thousand Equations
23
24
We (U.S.) Get Our Dust Too
True Color
Lake Tahoe
Nevada
California
? Understanding dust sources (and active periods,
e.g., seasonal lakebeds) improves our ability to
capture them in transport and dispersion models
(e.g., Navys COAMPS) for improved air quality
assessment.
6


