Profiling Memory Subsystem Performance in an Advanced POWER Virtualization Environment
1 / 1
Title:
Profiling Memory Subsystem Performance in an Advanced POWER Virtualization Environment
Description:
Austin, TX. Data Collection. 1. Environment. IBM eServer p5 570 (p570) architecture ... Austin Center for Advanced Studies (CAS) Conference, February 2004, Austin, TX. ... –
Number of Views:19
Avg rating:3.0/5.0
Title: Profiling Memory Subsystem Performance in an Advanced POWER Virtualization Environment
1
Profiling Memory Subsystem Performance in an
Advanced POWER Virtualization Environment
The prominent role of the memory hierarchy as one
of the major bottlenecks in achieving good
program performance has motivated the search for
ways of capturing the memory performance of an
application/machine pair that is both practical
in terms of time and space, yet detailed enough
to gain useful and relevant information. The
strategy that we endorse periodically samples
events during program execution, producing an
event trace that is both manageable and
informative. Additionally, we developed a fast
and flexible performance evaluation framework
with which to analyze and understand the
performance data contained within the sampled
event traces. We have shown the potential of our
performance evaluation methodology by using it to
analyze a disparate set of performance issues for
large, complex applications running on a
multiprocessor system. For example, we have
applied our methodology to characterize
performance issues such as memory access
performance, process migration, compulsory and
conflict misses, and false sharing. To date, we
have studied the memory subsystem performance of
several complex applications, including the TPC-C
and SPECsfs benchmarks, executing on different
configurations of the IBM eServer pSeries
690. Additionally, we have begun to investigate
the effectiveness of our performance evaluation
framework when studying memory subsystem
performance in a virtualized environment.
Virtualization allows multiple execution
environments to time-share the same physical
hardware in an effort to increase machine
utilization. However, there is an inherent
performance overhead associated with sharing a
fixed set of hardware resources. The goal of our
work is to identify and analyze the performance
overhead associated with virtualization using our
performance evaluation framework. To date, we
have studied the memory subsystem performance of
TRADE3, an on-line stock brokerage application,
executing on different configurations of the IBM
eServer p5 570, a commercial server designed to
support virtualization.
Department of Computer Science
Austin, TX
Bret Olszewski Mala Anand Carole Gottlieb
Diana Villa, Ph.D. Candidate Mitesh Meswani,
Ph.D. Candidate Dr. Patricia Teller, Professor
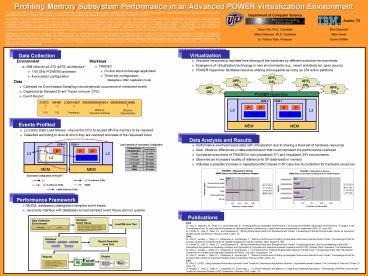
- Virtualize resources to facilitate time-sharing
of the hardware by different execution
environments - Emergence of virtualization technology in new
environments (e.g., newer architectures, open
source) - POWER Hypervisor facilitates resource sharing
and supports as many as 254 active partitions
- Environment
- IBM eServer p5 570 (p570) architecture
- 1.65 GHz POWER5 processor
- 4-processor configuration
- Workload
- TRADE3
- On-line stock brokerage application
- Three-tier configuration
- Websphere, DB2, Application Code
- Data
- Collected via Event-based Sampling (record
periodic occurrence of monitored event) - Organized as Sampled Event Traces (one per CPU)
- Event Record
- L2-Cache Data Load Misses - require the CPU to
access off-chip memory to be resolved - Classified according to level at which they are
resolved and state of the requested block
- Performance overhead associated with
virtualization due to sharing a fixed-set of
hardware resources - Goal Observe differences in data-load behavior
that could represent the performance overhead - Compared executions of TRADE3 in
non-virtualized (1P) and virtualized (5P)
environments - Observed an increased locality of reference for
5P data-loads in memory - Indicates a possible increase in
capacity/conflict misses in 5P case due to
contention for hardware resources
Load Latencies of 4-processor Configuration
4-processor configuration of the p570
L2.75 (different DCM)
L3
L3.75 (different DCM)
LMEM
LMEM (different DCM)
3
Performance Framework
- MySQL databases catalog/store sampled event
traces - Java tools interface with databases to load
sampled event traces and run queries
- 2005
- Villa, D., Meswani, M., Teller, P.J., and
Olszewski, B., "Profiling Memory Subsystem
Performance in an Advanced POWER Virtualization
Environment", To appear in the Proceedings of the
1st International Workshop on Operating System
Interference in High Performance Applications,
September 2004, St. Louis, MO. - Portillo, R., Villa, D., Teller, P.J., and
Olszewski, B., "Mining Performance Data from
Sampled Event Traces", Proceedings of the 6th
Annual Austin Center for Advanced Studies (CAS)
Conference, February 2005, Austin, TX. - 2004
- Villa, D., Acosta, J., Teller, P.J., Olszewski,
B., and Morgan, T., "Memory Performance Profiling
via Sampled Performance Monitor Event Traces",
Proceedings of the 5th Annual Los Alamos Computer
Science Institute Symposium (LACSI), October,
2004, Santa Fe, NM. - Portillo, R., Villa, D., Teller, P.J., and
Olszewski, B., "Mining Performance Data from
Sampled Event Traces", Proceedings of the 12th
Annual Meeting of the IEEE International
Symposium on Modeling, Analysis, and Simulation
of Computer and Telecommunication Systems
(MASCOTS), October 2004, Volendam, The
Netherlands. - Villa, D., Acosta, J., Teller, P.J., Olszewski,
B., and Morgan, T., "A Framework for Profiling
Multiprocessor Memory Performance", Proceedings
of the 10th International Conference on Parallel
and Distributed Systems (ICPADS), July 2004, Long
Beach, CA. - Villa, D., Acosta, J., Teller, P.J., Olszewski,
B., and Morgan, T., "Memory Performance Profiling
via Sampled Performance Monitor Event Traces",
Proceedings of the 5th Annual Austin Center for
Advanced Studies (CAS) Conference, February 2004,
Austin, TX. - 2003
- Villa, D. (2003). Using Sampled Performance
Monitor Event Traces to Characterize Application
Behavior. Unpublished master's thesis, The
University of Texas at El Paso, El Paso, TX. - Morgan, T., Villa, D., Teller, P.J., Olszewski,
B., and Acosta, J., "L2 Miss Profiling on the
p690 for a Large-scale Database Application",
Proceedings of the 4th Annual Austin Center for
Advanced Studies (CAS) Conference, February 2003,
Austin, TX.


