PBL Verification with Radiosonde and Aircraft Data - PowerPoint PPT Presentation
Title:
PBL Verification with Radiosonde and Aircraft Data
Description:
VERIFICATION DOMAINS. G245. G247. G246. Western US. Eastern US. Central US ... NMM) model are verified with different types of available real-time observations. ... – PowerPoint PPT presentation
Number of Views:27
Avg rating:3.0/5.0
Title: PBL Verification with Radiosonde and Aircraft Data
1
PBL Verification with Radiosonde and Aircraft
Data
M. Tsidulko¹, J. McQueen², G. DiMego², M. Ek²
AIRCRAFT
16 Nov 03 Dec 2008 hourly statistics
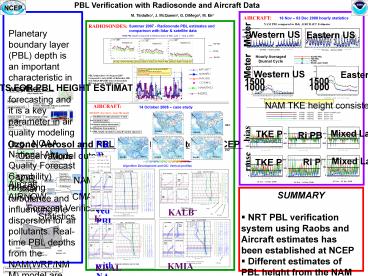
Planetary boundary layer (PBL) depth is an
important characteristic in weather forecasting
and it is a key parameter in air quality modeling
(e.g. NOAA National Air Quality Forecast
Capability) reflecting turbulence and influencing
the dispersion for air pollutants. Real-time PBL
depths from the NAM(WRF/NMM) model are verified
with different types of available real-time
observations. PBL depth verification is
incorporated into the NCEPs verification system
including the ability to provide a range of
statistical characteristics for the boundary
layer heights. For the model, several types of
boundary layer heights are defined From the NAM
TKE scheme A critical Ri number approach and
a mixed layer depth defined where the NAM TKE
dissipation term exceeds the TKE production tem.
Observed PBL depths from radiosonde and
aircraft are determined by applying a critical Ri
number approach to their profiles. Howard
University/NCAS lidar (HURL), NASA MPLNET and the
COSMIC satellite GPS PBL estimates are also used
to evaluate the real-time derived products.
NAM PBL compared to Hrly AIRCRAFT Estimates
RADIOSONDES
Summer 2007 - Radiosonde PBL estimates and
comparison with lidar satellite data
2000
Western US
Eastern US
NAM PBL Depth compared to Radiosondes at 00Z
July 1 Sep 2, 2007
1000
Meter
16 Nov 03 Dec 2008
16 Nov 03 Dec 2008
Hourly Averaged Diurnal Cycle
At 00z, NAM TKE PBL performs better in West US,
NAM Ri PBL performs better in East US
Hrly HURL PBL in relatively good agreement with
MPLNET, but sometimes lower A diurnal cycle is
evident for all hrly estimates MPLNET algorithm
may need to be refined to capture inversion base
more accurately
Western US
Eastern US
Meter
PBL height (km) 1-10 August 2007 Compared to hrly
HURL at Beltsville, MD Hrly NASA MPLNET lidar at
Greenbelt, MD and nearest COSMIC retrievals
1500
1500
1000
1000
NAM TKE height consistently higher than ACARS
estimates
AIRCRAFT
14 October 2008 case study
00Z
RAOBS
TKE PBL
ACARS
TKE PBL
400
RAOBS
ACARS
bias
NRT ACARS derived PBL comparisons with NAM PBL
-400
-400
-400
18Z
Ri PBL
TKE PBL
Mixed Layer
ACARS
ACARS
ACARS
Algorithm Development and QC Vertical profiles
rmse
?v
Wind speed
16 Nov 03 Dec 2008
16 Nov 03 Dec 2008
16 Nov 03 Dec 2008
- SUMMARY
- NRT PBL verification system using Raobs and
Aircraft estimates has been established at NCEP - Different estimates of PBL height from the NAM
model (PBL height and Mixed layer depth from TKE
scheme, PBL height from Ri number approach) are
verified with RAOBS data - ACARS estimated PBL hieghts are incorporated
into FVS system hourly evaluations are provided - Several problems detected with regards to PBL
height algorithm - INSTRUMENT COLOCATION STUDY
- Comparison of co-located LIDAR estimates for
August 2007 show that PBL heights from MPLNET
(Goddard) and Howard University (Beltsville)
LIDAR observations are in relatively good
agreement However, MPLNET data is not QCd and
noisier and likely too high - COSMIC PBL estimates are usually higher than
Lidar estimates - RAOBS PBL estimates are generally lower than
Lidar estimates - Comparison of Model PBL heights with LIDAR and
COSMIC data are inconclusive since observations
appear to often capture cloud base rather than
mixed height inversion layer - Improved lidar algorithms are under development
to capture pollutant mixed layer height
(inversion layer instead of cloud base layer) -
PLANS - Improve QC of ACARS profiles (eg eliminate data
with too few vertical levels) - Add individual airports to VSDB records to
compare model performance at local sites - Quantify contribution of NAM forecast pbl errors
to AQ forecast errors - Add PBL from other models
q
Ri no TKE
KLAX
All model estimates are too low
1 Scientific Applications International
Corporation, Camp Springs, Maryland. 2 National
Centers for Environmental Prediction, Camp
Springs, Maryland.
NAMY


