
Average Soil Nitrate following Wheat in 2005 - PowerPoint PPT Presentation
1 / 27
Title:
Average Soil Nitrate following Wheat in 2005
Description:
Soil Nitrate Variability Between Fields Following 'Flax' in Canada - 2005. Average Soil Nitrate ... Following 'FLAX in Canada. 1988-2005. 88 89 90 91 92 93 94 ... – PowerPoint PPT presentation
Number of Views:22
Avg rating:3.0/5.0
Title: Average Soil Nitrate following Wheat in 2005
1
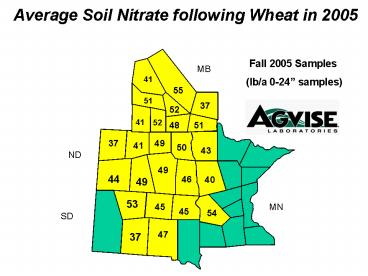
Average Soil Nitrate following Wheat in 2005
Fall 2005 Samples
MB
41
(lb/a 0-24 samples)
55
51
37
52
52
41
48
51
49
37
41
50
43
ND
49
44
46
40
49
53
45
MN
45
54
SD
47
37
2
Soil Nitrate Variability Between Fields
Following WHEAT in Canada - 2005
3
Average Soil Nitrate Following WHEAT in Canada
1986-2005
107
96
81
68
64
59
58
56
Nitrate-N (0-24) lb/a
50
50
50
49
49
47
46
42
42
39
38
35
86 87 88 89 90 91 92 93 94 95 96 97 98 99 00 01
02 03 04 05
4
Soil Nitrate Variability Between Fields
Following Barley in Canada - 2005
5
Average Soil Nitrate Following BARLEY in Canada
1986-2005
81
70
64
64
60
58
58
Nitrate-N (0-24) lb/a
55
53
50
50
49
47
45
44
43
39
38
36
35
86 87 88 89 90 91 92 93 94 95 96 97 98 99 00 01
02 03 04 05
6
Soil Nitrate Variability Between Fields
Following Flax in Canada - 2005
7
Average Soil Nitrate Following FLAX in Canada
1988-2005
89
87
60
58
56
Nitrate-N (0-24)
51
48
47
42
42
40
38
38
37
34
32
31
24
88 89 90 91 92 93 94 95 96 97 98 99 00 01
02 03 04 05
8
Soil Nitrate Variability Between Fields
Following Canola in Canada - 2005
9
Average Soil Nitrate Following CANOLA in
Canada 1988-2005
82
75
60
60
57
57
53
51
49
44
Nitrate-N (0-24) lb/a
43
40
37
36
34
32
32
29
88 89 90 91 92 93 94 95 96 97 98 99 00
01 02 03 04 05
10
Soil Nitrate Variability Between Fields
Following Potato in Canada - 2005
11
Average Soil Nitrate Following POTATO in
Canada 1988-2005
106
96
93
92
81
81
79
74
73
72
72
70
68
Nitrate-N (0-24)
62
61
54
51
39
88 89 90 91 92 93 94 95 96 97 98 99 00 01
02 03 04 05
12
Soil Nitrate Variability Between Fields
Following Corn in Canada - 2005
13
Average Soil Nitrate Following CORN in Canada
1988-2005
117
106
96
93
90
85
84
85
Nitrate-N (0-24)
71
65
64
65
64
63
59
54
55
54
88 89 90 91 92 93 94 95 96 97 98 99 00
01 02 03 04 05
14
Average Soil Nitrate following Corn in 2005
Fall 2005samples
MB
(lb/a 0-24 samples)
61
57
44
44
56
43
39
ND
50
45
52
36
46
47
52
42
MN
54
36
SD
54
67
58
57
15
Soil Nitrate Variability Between Fields
Following Soybean in Canada 2005
16
Average Soil Nitrate following Soybeans in 2005
Fall 2005 samples
MB
(lb/a 0-24 samples)
43
36
28
32
25
29
24
26
ND
31
28
30
23
26
26
MN
24
28
SD
37
31
31
17
Soil Samples with Zinc less than 1.0 ppm
MB
Fall 2005 samples
37
59
(0-6 samples)
38
47
23
57
43
39
39
67
93
85
53
62
50
ND
64
14
89
63
66
63
27
78
67
MN
63
36
SD
36
61
81
46
53
18
Soil Samples with Sulfur less than 15 lb/a
MB
Fall 2005 samples
8
8
(0-6 samples)
28
1
5
11
21
4
4
14
55
18
10
33
9
ND
27
53
36
26
17
48
65
59
34
MN
40
46
SD
70
35
68
55
50
19
Soil Samples with Copper less than 0.5 ppm
MB
Fall 2005 samples
20
9
(0-6 samples)
22
1
19
17
17
10
21
21
3
9
24
32
43
ND
18
31
11
27
20
21
13
5
MN
30
4
4
SD
5
1
2
6
0
20
Soil Samples with Chloride less than 40 lb/a
MB
Fall 2005 Samples
44
(0-24 samples)
40
78
83
27
70
75
15
28
66
91
57
47
26
84
ND
80
89
48
66
88
88
69
MN
72
81
76
SD
78
88
84
78
94
21
Soil Samples with OM less than 3.0
MB
Fall 2005 samples
30
12
(0-6 samples)
15
2
33
19
22
17
24
50
91
66
38
43
28
ND
47
89
37
76
39
51
44
40
MN
67
20
16
SD
19
42
6
47
29
22
Soil Samples with Boron less than 0.8 ppm
MB
Fall 2005 samples
14
(0-6 samples)
8
1
15
26
44
23
22
21
73
69
35
45
70
ND
58
96
71
55
51
75
90
81
MN
67
48
SD
72
81
66
80
84
23
Soil Samples with Carbonate greater than 5.0
MB
Fall 2005 samples
57
(0-6 samples)
18
12
18
16
7
41
9
7
3
15
27
ND
2
0
10
2
38
0
4
1
MN
2
16
SD
9
2
24
Soil Samples with Salts greater than 1.0
MB
Fall 2005 Samples
11
7
(0-6 samples)
8
7
15
6
5
13
15
11
2
3
24
15
4
ND
6
1
11
1
8
1
1
1
5
MN
4
9
SD
2
2
8
3
1
25
Soil Samples with Soil pH greater than 7.3
MB
Fall 2005 samples
87
97
(0-6 samples)
82
80
83
76
64
87
79
78
80
59
80
62
94
ND
52
13
72
46
86
30
40
23
24
MN
43
76
SD
38
23
46
33
29
26
Soil Samples with Potassium less than 150 ppm
MB
Fall 2005 samples
52
20
(0-6 samples)
33
6
31
11
16
19
13
4
6
1
19
38
80
ND
5
71
23
5
49
4
52
2
MN
2
25
27
SD
52
45
1
6
25
27
Soil Samples with Phosphorus less than 10 ppm
Fall 2005 samples
MB
(0-6 samples)
63
59
(Olsen P test)
59
43
19
58
46
25
34
82
88
84
65
71
72
ND
67
19
62
75
70
68
41
61
53
MN
68
48
SD
45
40
65
42
52
Recommended
CrystalGraphics Presentations


