
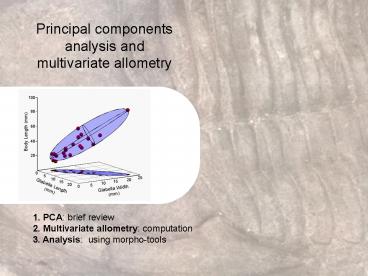
Principal components analysis and multivariate allometry - PowerPoint PPT Presentation
1 / 31
Title:
Principal components analysis and multivariate allometry
Description:
PCA takes your variables (X1, X2, ..., Xp) and returns a new set of variables ... X4: = eye diam. X5: = ... How does PC2 relate to the original variables? High PC2 ... – PowerPoint PPT presentation
Number of Views:178
Avg rating:3.0/5.0
Title: Principal components analysis and multivariate allometry
1
Principal components analysis and multivariate
allometry
1. PCA brief review 2. Multivariate allometry
computation 3. Analysis using morpho-tools
2
PCA takes your variables (X1, X2, , Xp) and
returns a new set of variables (Z1, Z2, , Zp),
such that 1. the new variables are independent
of one another, 2. the variables are sorted such
that Var(Z1) Var(Z2) Var (Zp) 3. The
relationships among specimens (distances,
relative positions) are preserved, and 4. the
geometric relationships between old (measured)
and new variables are both constant and easy to
interpret in a meaningful, qualitative manner
3
Length 2
Length 1
PC2
PC1
4
Your new variables are all functions of the old
ones Z1 a11X1 a12X2 a1pXp Z2
a21X1 a22X2 a2pXp Z3 a31X1 a32X2
a3pXp Zp ap1X1 ap2X2 appXp
Z1 is the score of a specimen along PC1
5
40.0
PC-1
20.0
PC-2
2.7 (5.5)
46.3 (94.5)
glabella width (mm)
0.0
-20.0
-40.0
-40.0
-20.0
0.0
20.0
40.0
glabella length (mm)
PCA computes the major and minor axes of these
ellipses. This ellipse is our model for the
distribution underlying these two variables. The
major axis of this ellipse is, in fact, the same
as a major axis regression line.
6
PCA PCA software
The old software was horrifying. If you are
frustrated with morpho-tools, Im happy to let
you try Norms old programs.
7
Perform the regression analysis
Simply use the output of lab 2 the set of
Euclidean distances for all of your measurements
across all specimens with the size column
removed
8
X1 canine L X2 braincase W X3 X4
X5
data
PCA
eigenvalues
eigenvectors
scores
9
raw data
eigenvalues
Log-transformed data
eigenvalues
10
Results (log-transformed)
X1 canine L X2 braincase W X3 X4
X5
loadings
These loadings can be used for three things
11
Results (log-transformed)
X1 canine L X2 braincase W X3 X4
X5
These loadings can be used for three things 1)
calculate your scores 2) interpret your PC axes
in terms of your original variables (X1, X2,
) 3) calculate multivariate allometry
12
40.0
PC-1
20.0
PC-2
2.7 (5.5)
46.3 (94.5)
glabella width (mm)
0.0
-20.0
-40.0
-40.0
-20.0
0.0
20.0
40.0
glabella length (mm)
Computing scores PC1 a11X1 a12X2 a13X3
a14X4 a15X5 PC2 a21X1 a22X2 a23X3
a24X4 a25X5
13
X1 canine L X2 braincase W X3 X4
X5
loadings
original data
Z1 (.184)X1 (.166)X2 (.185)X3 (.180)X4
(.162)X46 31.057 Z2 (-.327)X1
(.025)X2 (-.332)X3 (-.352)X4 (.105)X46
4.088
scores
14
Interpreting PCs relative to the original
variables...
How does PC2 relate to the original variables?
X1 canine L X2 braincase W X3 braincase
H X4 eye diam. X5
15
X1 canine L X2 braincase W X3 braincase
H X4 eye diam. X5
How does PC2 relate to the original variables?
16
X2
X3
High PC2
Low PC2
X1 canine L X2 braincase W X3 braincase
H X4 eye diam. X5
How does PC2 relate to the original variables?
17
Calculating multivariate allometry...
loadings
Multivariate allometry uses PC1
18
loadings
Multivariate allometry uses PC1 Isometry vector
1/Sqrtnumber of measurements
1/Sqrt46 0.147
19
loadings
Multivariate allometry uses PC1 Isometry vector
1/Sqrtnumber of measurements
1/Sqrt46 0.147
20
loadings
Compared with the bivariate (major axis)
regression results
21
Lab 4 PCA
22
Lab 4 PCA
23
Bivariateallometry
Multivariateallometry
24
Lab 4 PCA
isometry
PCA - multivariate allometryBivariate regression
slope
25
Lab 4 PCA
26
Lab 3 PCA
PC-1 loadings (log-transformed measurements) Green
high positive loadingRed high negative
loadingWhite Intermediate
27
Lab 3 PCA
PC-2 loadings (log-transformed measurements) Green
high positive loadingRed high negative
loadingWhite Intermediate
28
Lab 3 PCA
expansion of the central skull, particularly
the zygomatic arch, some elongation of the
eyeclosing of the gap at the rear of the
eye socket ventral, posterior surface of the he
skull shows a size decrease.
cheetah
Pantherinae
Machairodontinae
Felinae
elongation of the facecompression of the
eyeelongation of the glenoid fossaflattening of
rear of skull
PC-1 loadings (log-transformed measurements)
29
Allometry BV / MV
Bivariate allometry you examined the
distribution of /-/isometry across your
variables (your net of distance measurements),
one variable at a time, regressing each against a
size measure youve selected Multivariate
allometry you will examine the distribution of
/-/isometry across your variables using the
first new variable (PC1), with size implicit in
the measurements and isometry defined by the
isometric vector in your PCA space (1/vnumber of
measurements) The results should look similar to
those for bivariate allometry (Lab 3), depending
on your size measure regression approach. Make
a plot in Excel to confirm this (see lab manual).
30
Formatting your data
Size is implicit in the measurements.
Unless your size column is one of the
measurements in your net, dont include it in the
PCA.
31
Practical 4 PCA multivariate allometry
-3) select relocatable landmarks -2) place
landmarks on all specimens -1) decide on
measurement net, 0) compute measurements across
a measurement net for all specimens 1) PCA on
morpho-tools.net 2) plot the allometry net
and.. oh, lil Chihuahua!... were your head to
shrink,the beauty of your eyes would only grow,
I think,because the blessed touch of Allometry,
I hypothesize,will ensure they (relatively) grow
even as you diminish in size
Recommended
CrystalGraphics Presentations


