Powerpoint template for scientific posters Swarthmore College
1 / 1
Title:
Powerpoint template for scientific posters Swarthmore College
Description:
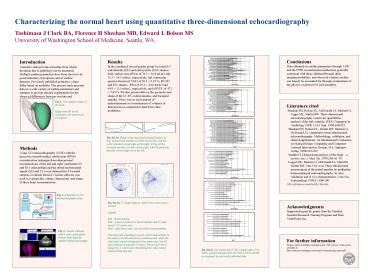
Shape of the mitral and tricuspid annuli. ... Red - mitral annulus. Pink - points at centroid of mitral annulus and LV apex ... – PowerPoint PPT presentation
Number of Views:61
Avg rating:3.0/5.0
Title: Powerpoint template for scientific posters Swarthmore College
1
Characterizing the normal heart using
quantitative three-dimensional echocardiography To
shimasa J Clark BA, Florence H Sheehan MD, Edward
L Bolson MSUniversity of Washington School of
Medicine, Seattle, WA.
Conclusions Data obtained on cardiac parameters
through 3-DE and the PSSS reconstruction method
are generally consistent with those obtained
through other imaging modalities, and observed
variance in data can largely be accounted for
through examination of the physics or protocol of
each modality.
Results In the combined, mixed-gender group we
found LV end-diastolic (ED) and end-systolic (ES)
volumes / body surface area (BSA) of 76.5 16.8
ml/m2 and 35.3 14.1 ml/m2, respectively, left
ventricular ejection fraction (LVEF) of 56.1
9.93 , RV ED and ES volumes / BSA of 93.2 20.0
ml/m2 and 49.9 13.5 ml/m2, respectively, and a
RVEF of 47.3 7.69 . We also present data on
the geometry and shape of the LV, RV, mitral
annulus, and tricuspid annulus. There was no
clear pattern of understatement or overstatement
of volumes or dimensions as compared to data from
other modalities.
Introduction Normative data provide a baseline
from which deviation due to pathology can be
measured. Multiple cardiac parameters have been
shown to be good indicators of prognosis and of
cardiac function. Previously published normative
values differ based on modality. This present
study presents data on a wide variety of cardiac
parameters and attempts to provide rational
explanations for the observed differences between
our data and published norms.
Literature cited Sheehan FH, Bolson EL, McDonald
JA, Bashein G, Zeppa ML, Martin RW. Three
dimensional echocardiography system for
quantitative analysis of the left ventricle. IEEE
Computers in Cardiology 1998 13-16 Sept.
1998649-652. Sheehan FH, Bolson EL, Martin RW,
Bashein G, McDonald JA. Quantitative three
dimensional echocardiography Methodology,
validation, and clinical applications. 1st
International Conference on Medical Image
Computing and Computer-Assisted Intervention.
Boston, MA Springer-Verlag, 1998102-109.
Sandler H. Dimensional analysis of the heart a
review. Am. J. Med. Sci. 19702605670. Legget
ME, Bashein G, McDonald JA, Munt BI, Martin RW,
Otto CM, et al. Three-dimensional measurement of
the mitral annulus by multiplane transesophageal
echocardiography In vitro validation and in vivo
demonstration. J Am Soc Echocardiogr
199811188-200. 106 references omitted for
brevity.
Fig. 1. The complex shape of the heart. Right
ventricle in red wireframe, left ventricle in
solid green.
Fig. 4(a-b). Shape of the mitral and tricuspid
annuli. In Fig. 4a the mitral annulus is visible
on the left, with the aortic annulus viewed
edge-on the right. In Fig. 4b the tricuspid
annulus is visible on the right, with the
pulmonic annulus viewed edge-on on the left.
Methods Using 3-D echocardiography (3-DE) with
the piecewise smooth surface subdivision (PSSS)
reconstruction technique three-dimensional
reconstructions of the left and right ventricular
(LV and RV) endocardium and the mitral and
tricuspid annuli (MA and TA) were obtained for 67
normal subjects or subsets thereof. Custom
software was used to evaluate the volume,
dimensions, and shape of these heart
reconstructions.
Fig. 2. Schematic of 3-D echocardiography setup
Acknowledgments Supported in part by grants from
the Medical Scientist Research Training Program
and from VentriPoint, Inc.
Fig. 5(a-b). LV shape analysis Radii from center
axis to vertices. Legend Red - mitral
annulus Pink - points at centroid of mitral
annulus and LV apex Green - LV center axis Blue -
radii from center axis to points on
endocardium Note that radii extending to points
on the endocardium in the apical 1/3rd all start
from a common point, while the other radii extend
orthogonal to the center axis. Not all radii
depicted in interests of clarity. The second view
is along the LV center axis, illustrating how
radii extend outward from this axis.
Fig. 3. Custom software used to trace endocardial
borders from digitally captured ultrasound images
For further information Please contact
tjclark_at_u.washington.edu. PDF version of this
poster available at http//students.washington.edu
/tjclark/Characterizing_poster.pdf
Fig. 6(a-f). Our results for LV ED volume index
(VI), ESVI, ejection fraction (EF), RV EDVI,
ESVI, RVEF as compared to previously published
data.


