
How COCMP and OOS programs can be used in a response
1 / 12
Title:
How COCMP and OOS programs can be used in a response
Description:
Historical Data Base of Meteorological and Oceanographic Conditions which ... Is a long term change to the biota driven by event or climate change? EXAMPLE PRODUCTS ... –
Number of Views:34
Avg rating:3.0/5.0
Title: How COCMP and OOS programs can be used in a response
1
How COCMP and OOS programs can be used in a
response Eric Terrill Scripps Institution of
Oceanography
2
- Three Different Classes of Activities
- Planning
- Response
- Impact Assessment
3
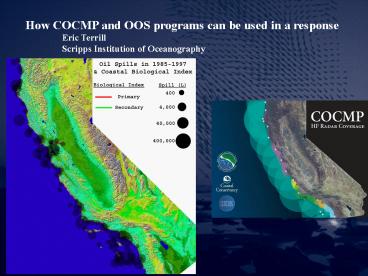
- Planning risk assessment and spill scenario
response analysis - Facilitate and Organize Data for Risk Assessment
- Data for Natural Resource Damage Assessment
- Biological Resources
- Beneficial Uses
- Historical Data Base of Meteorological and
Oceanographic Conditions which influence spill
transport and dispersion - Ocean currents, winds, waves, stratification
- Synthesis of current patterns Tidal Analysis of
best qa/qcd data - Develop Products using statistical trajectory
synthesis risk indices - Support existing Area Committees/Groups, raise
awareness of ocean observing customer base,
establish best practices for flow of information
during incident
4
- Response During Event
- Delivery of timely data relevant to spill
response activities - Factors which influence oil spill transport
(nowcast and forecasts) One Stop Shopping
Integrated Products - Ocean currents
- Wind conditions
- Waves
- Factors which influence response type and
capability - Sea State
- Visibility
- Maps of sensitive resources
- Specialized Data collection and Products during
Event - Drifter deployments
- Specialized sampling gear (eg. Fluorometers) to
support of USCG Smart Teams - Relocatable resources
5
- Post Event Impact Assessment
- Accurate Hindcast of environment
- Data driven models of 3-D circulation (currents,
winds, waves, ocean state) . - Easy Access to environmental data for response
assessment - Long Term Trends of environment
- Is a long term change to the biota driven by
event or climate change?
6
EXAMPLE PRODUCTS
7
Products Gap filled data, Trajectories Inside
SF BAY
8
Products Gap filled data, Trajectories Outside
SF BAY
9
LA/LB Customized Web Interface
- NOAA charts integrated with Model Output
Prediction Points at key transfer locations - Overlay for Shipping Lanes, Swell Model, and
Surface Currents
10
Features Toggle On/Off Overlays and Model
Output Prediction Points
- Surface currents or swell model overlay
with/without Model Output Prediction (MOP)
locations
11
Access to Near Real-Time Data Feeds
- Wave Conditions and Surface Currents available in
near real-time
12
Interactive Google Maps Display of Near
Real-Time Surface Currents
Recommended
CrystalGraphics Presentations


