
Thermometers and Barometers for Volcanic Systems - PowerPoint PPT Presentation
1 / 27
Title: Thermometers and Barometers for Volcanic Systems
1
Thermometers and Barometers for Volcanic
Systems Keith Putirka California State
University, Fresno
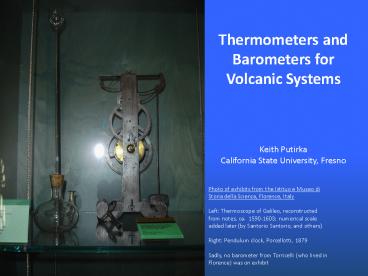
Photo of exhibits from the Istituo e Museo di
Storia della Scienza, Florence, Italy Left
Thermoscope of Galileo, reconstructed from notes,
ca. 1590-1603 numerical scale added later (by
Santorio Santorio, and others) Right Pendulum
clock, Porcellotti, 1879 Sadly, no barometer
from Torricelli (who lived in Florence) was on
exhibit
2
(No Transcript)
3
The first barometer Left Device used by
Torricelli (or rather his student, Vincenzo
Viviani) in 1643, to test whether air had
weight Here, mercury does not descend entirely
into the basin, but remains perched to a height
of about 76 cm or 30 inches in the tube.
4
- Outline of Talk
- Igneous Thermometers and Barometers
- Are they any good? (Sources of error)
- How do we know? (Tests for equilibrium)
- Why bother who cares anyway? (Applications)
5
1) Are they any good? Experimental and
Calibration Errors
Do minerals and liquids equilibrate in partial
melting experiments? (If so, not by lattice
diffusion)
Red dots olivine Black dots other
phases Blue line hydrous conditions Red line
anhydrous
Experimental run time vs. 10000/T(K) Lines
show time for diffusive Fe-Mg exchange across a
10 mm crystal Most experiments too short to
equilibrate via lattice diffusion
Hirschmann et al. (2008)
6
Experimental Error
But even short experiments appear to approach
equilibrium For example If KD(Fe-Mg)ol-liq
0.30 represents equilibrium most experiments
come close 51 fall within 0.03 80 fall
within 0.06 (1s 0.05 for n 1503)
Experimental Run Time vs. KD(Fe-Mg)ol-liq
7
Experimental Error
Experimental Run Time vs. Error on P (Eqn. 30)
And there is no global correlation between
experimental duration and error on P(kbar)
(P calculated using Eqn. 30)
8
Experimental Error
Experimental Run Time vs. Error on T (Eqn. 33)
Same goes for T(K) T calculated using Eqn. 33
9
Experimental Error
So are they any good? Possibly. But if
Minerals equilibrate during growth, but do not
re-equilibrate by lattice diffusion (and Ca,
or Na-Al charge couples diffuse more slowly than
Fe, Mg) Then In nature, as well as
experiments Jadeite or CaTs (thermobarometers)
record P-T of nucleation and growth, not mineral
residence.
10
Calibration Error
All models are wrong, but some are useful -
George Box
Galileos 1608 Experiments on Ballistic Trajectory
6th-order law s ah bh2 ch3 dh4 eh5
fh6 g
Quadratic law s ah bh2 c
Horizontal Distance (s)
Bayesian analysis provides justification for
simpler model
Initial Height (h)
Jefferys and Berger (1992)
11
Calibration Error
Harold Jeffreys (1939) argued that Bayesian
methods may provide quantitative support for
Ockhams razor Plurality must not be posited
without necessity Simpler models have a
higher probability of providing accurate
predictions Experimental error limits the
number of parameters that can be determined by
regression analysis
12
Calibration Error
For Example Why are some points further from
the regression line than others? Test data
(data not used for regression analysis) are
important for testing hypotheses
Y is affected by something other than X? Or do
residuals experimental error?
13
Calibration Error
As with accelerated motion, similar calibration
issues apply to geochemistry A 6-parameter model
can describe a set of data with higher precision
than its 2-parameter counterpart
14
Calibration Error
But the 2-parameter model predicts lnKeq for
non-calibration data (or test data) with much
less systematic error
15
Calibration Error
Example Two-Feldspar Thermometry
Banisek et al. (2004) 21 Parameters R2 0.0007
(lousy) Barth (1964) 2 Parameters R2 0.05
(less lousy) 40 years and 19 parameters later.
we move backward in our ability to predict T
Data from Elkins Grove (1990) Gerke Kilinc
(1992) Patino-Douce Beard (1995) Patino-Douce
Harris (1998) Koester et al. (2002) Patino-Douce
(2005) Auzqanneau et al. (2006)
16
Calibration Error
Example Two-Feldspar Thermometry
New models, derived from formulation of Barth
(1964) (7 parameters), capture T to within
30oC, R2 0.9
Data from Elkins Grove (1990) Gerke Kilinc
(1992) Patino-Douce Beard (1995) Patino-Douce
Harris (1998) Koester et al. (2002) Patino-Douce
(2005) Auzqanneau et al. (2006)
17
So how good are they? (what magnitudes of errors
might we expect?)
Most thermometers are probably accurate to
20-30oC Averaging appears to offer no help
Barometers are probably no more accurate than
2-3 kbar on individual estimates Possibly as
low as 1 kbar when averaging multiple grains
18
2) How do we know? Error of Application/Tests for
Equilibrium
The Rhodes Diagram
Fe-Mg exchange a useful test for phase
equilibrium Rhodes Diagram usu. Fo vs.
Mg(whole rock) Mg Mg/(FeMg) But can be
applied to any system where Fe-Mg exchange
applies pyx - liq cpx - opx
KD(Fe-Mg)ol-liq 0.320.03
Olivine removal
Olivine accumulation
Closed System Fractionation (when using whole
rocks for abscissa)
19
Error of Application (and tests for equilibrium)
Dynamic Experiments (from Grove and Bence, 1979)
All experiments performed at 1 atm P(kbar)
calculated from Eqn. 29 (based on
CaTs) Results Low cooling rate -0.5
kbar Moderate cooling rate 2.8 kbar Rapid
cooling rate gt4.0 kbar
20
Error of Application (and tests for equilibrium)
Dynamic Experiments (from Grove and Bence, 1979)
Why do P estimates increase with cooling
rate? Barometer (Eqn. 29) is based on
partitioning of Al between cpx and liq. DAl
increases with cooling rate (higher DAl
represent disequilibrium Lofgren et al., 2006)
21
Error of Application (and tests for equilibrium)
Dynamic Experiments (from Grove and Bence, 1979)
Fe-Mg exchange is also affected Though, oddly,
moderate cooling rate experiments most closely
approach expected equilibrium value of
0.30 (Gray box shows application of Eqn. 35)
22
Error of Application (and tests for equilibrium)
Models allow for tests of equilibrium in natural
samples
Other tests may be useful Putirka (1999)
presents models to predict cpx component, given
an equilibrium liquid, P and T. Low cooling rate
experiments consistent with equilibrium Other
experiments fail this test
23
Applications
Results From Hawaii
Sub-solidus equilibria, Mineral-liquid
equilibria Both yield depth estimates that
cluster over the depth range 10-17 km Supports
Garcia et al. (1995) model that (most) magmas
stall at the Moho (8-14 km)
24
3) Who Cares Anyway? Applications
Results From Puu Oo Episode 1-10
Depth estimates indicate top-to-bottom emptying
of conduit Does eruption depth correlate with
Water content in MI? degree of volatile
saturation? Variation in MI comp Each may be
impt for understanding eruption triggering
mechanisms, magmatic diversity
25
Applications
Results Partial Melting Depths from OIB
P calculated from Si-activity barometer
correlates with total FeO, which should increase
with partial melting depth Parental melt
compositions from Putirka (2008, Geology)
26
- Summary
- T can be estimated to 30 oC for nearly any rock
type - P can be estimated to perhaps 1 or 2 kbar for
clinopyroxene- or fluid inclusion-bearing systems - Multiple tests for equilibrium are sometimes
needed - Can Precision Be Increased? Perhaps, using
- Focused data sets
- tests using natural samples
- dynamic experiments - tests of equilibrium
- mostly not
- New Models
- Cpx hygrometer (Wade et al., 2008, Geology)
- Plag hygrometer (Lange et al., in prep)
27
Thanks for coming!
Relief Peak volcanics above, Mesozoic granite
below central Sierra Nevada, CA. Photo by Cathy
Busby
Recommended
CrystalGraphics Presentations


