
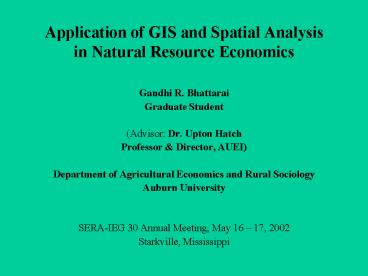
Application of GIS and Spatial Analysis in Natural Resource Economics
1 / 19
Title:
Application of GIS and Spatial Analysis in Natural Resource Economics
Description:
SERA-IEG 30 Annual Meeting, May 16 17, 2002. Starkville, Mississippi ... Externalities spread downstream or to an area around the source. Measuring the influence: ... –
Number of Views:128
Avg rating:3.0/5.0
Title: Application of GIS and Spatial Analysis in Natural Resource Economics
1
Application of GIS and Spatial Analysis in
Natural Resource Economics
- Gandhi R. Bhattarai
- Graduate Student
- (Advisor Dr. Upton Hatch
- Professor Director, AUEI)
- Department of Agricultural Economics and Rural
Sociology - Auburn University
- SERA-IEG 30 Annual Meeting, May 16 17, 2002
- Starkville, Mississippi
2
Geographic Dimensions in NRE
- Spatial influences in space
- Resources spread over geographical space
- Beneficiaries clustered around the resources
- Externalities spread downstream or to an area
around the source - Measuring the influence
- Where? (Zone of Impact)
- How much? (Degree of influence)
- In what way? (Nature of spatial relationship)
3
Geographic Information System (GIS)
- A set of Software, Hardware and the Operator
ESRI, 1999 - Facilitates analysis of geo-referenced data in
space - Data availability
- Digitized data recording by many institutions
- Different forms grids, shape files, coverages,
images etc. - Application packages
- Different packages for different uses
- ArcView, ArcGIS, ArcInfo etc.
4
Spatial Analysis
- Application of statistical methods to the
solution of geographical research questions
Gattrell - Relatively new area
- Two perspectives (Anselin)
- Data-driven exploratory, descriptive,
geo-visualisation - Model-driven spatial econometrics, spatial
prediction, spatial statistics, hypothesis
testing and model fitting - Limited functionality available in existing
statistical softwares like SAS - Spatial Analysis software SPACESTAT
5
Usefulness of GIS and Spatial Analysis
- Accuracy
- Easy in operation
- Great Analytical Capabilities
- Applied to Precision Agriculture, Land Use
planning, Environmental Quality, Forest Planning
etc - Two examples follow this slide
6
- Task I
- Potential site selection for block forest
plantation in Henry county in Alabama - Selection Criteria
- Within 5 km from any major roads
- Not within 50 meters from any streams
- Not within 1 km from any urban areas
- Current land use as transitional, shrub land or
fallow land (Classified as grid-code) - At least 50 acre in one block
7
- Activities
- Digitization of maps or use of available
digitized maps - Delineation of buffer areas
- Geo-processing clip, merge, identity etc.
- Spatial overlay
- Reselection using selection codes
8
Road.shp (UTM) River.shp (UTM) Uarea.shp
(UTM) County.shp (UTM)
IMPORT GRID GRIDARC
Lcover
Henry_utm (Grid, UTM)
CLEAN
lcovcn01
SHAPE ARC
Road River Uarea County
FINALCOV1
IDENTITY
ADDITEM (HA, SUITABLE) CALCULATE (AREA,
HA) RESELECT AREA GE 20 HA AND GRID-CODE 33
AND INSIDE 100 CALCULATE SUITABLE 1
BUILD, CLEAN
Roadbuf rivrbuf Rdrivbuf Rdrivbuf uarabuf
rdrivara Rdrivara gt bufcov
Roadbd01 Rivrbd01 Uaracn01 Councn01
ARC ERASE INSIDE100
Roadbuf (within 5 km) Rivrbuf (min. 50m
away) Uarabuf (not within 1km)
FINALCOV
BUFFER
RESELECT SUITABLE 1 FINAL REPORT
9
An example of spatial operation (Buffer)
M
a
j
o
r
R
o
a
d
s
s
t
M
i
x
e
d
F
o
r
e
s
t
P
a
s
t
u
r
e
/
H
a
y
R
o
w
C
r
o
p
s
W
o
o
d
y
W
e
t
l
a
n
d
s
E
m
e
r
g
e
n
t
H
e
r
b
a
c
e
o
u
s
10
Selected Areas for Forest Plantation
P
o
t
e
n
t
i
a
l
s
i
t
e
s
A
R
E
A
(
H
A
)
S
I
T
E
3
7
6
7
2
0
.
6
1
0
2
7
.
1
7
8
4
5
5
6
e
B
A
R
B
O
U
R
2
8
.
8
0
0
7
8
8
2
v
i
R
8
5
.
4
1
0
1
0
5
5
6
e
r
e
e
h
v
2
1
7
.
6
3
7
1
4
7
6
2
i
c
o
R
o
H
E
N
R
Y
h
e
1
1
2
.
6
8
3
2
8
6
8
9
e
a
t
h
t
a
c
h
3
3
.
6
6
0
6
2
7
9
6
a
C
w
a
t
5
1
.
4
8
2
6
4
5
8
1
k
a
h
C
7
3
.
7
1
0
8
3
2
5
1
3
5
.
0
2
5
8
5
4
9
3
k
e
e
r
C
e
i
b
b
r
A
e
U
r
b
a
n
a
r
e
a
v
i
R
P
r
i
n
c
i
p
a
l
r
o
a
d
s
e
1
6
4
5
8
1
e
M
a
j
o
r
r
i
v
e
r
s
h
k
c
e
S
e
l
e
c
t
e
d
s
i
t
e
s
a
e
w
r
C
o
u
n
t
y
b
o
u
n
d
a
r
y
a
C
t
k
n
a
a
h
8
3
2
5
1
8
3
2
5
1
m
C
r
e
t
8
5
4
9
3
8
5
4
9
3
e
N
P
E
W
S
K
m
5
0
5
1
0
11
- Task II
- Estimating a regression model to explain
farmland values in Alabama counties in the
presence of spatial effects - GIS steps
- Geo-referenced polygons or centroids from GIS
- GIS data to database/text conversion
- Spatial Analysis Steps
- Formation of Contiguity Matrix
- Formation of Spatial Weight Matrix
- Running Spatial Regression Models in SpaceStat
- Display results in GIS or in Tables
12
Terminology
- Contiguity
- Countyj in any direction from Countyi measured
from centroid to centroid within a hypothesized
limit for spatial influence - Contiguity Matrix
- nxn matrix of observations based on contiguity
- Wij 1 for contiguous counties 0 for others
- Spatial Weight Matrix
- Inverse Distance Matrix based on contiguity, Row
standardized N by N positive, Symmetric Matrix
13
Example Detecting Spatial Dependence
a. GIS Map visualisation b. Moran Scatterplot of
relationship
14
Example Diagnostics for Spatial Dependence
TEST
MI/DF VALUE PROB Moran's I (error)
0.0069 0.664 0.507 Lagrange Multiplier
(error) 1 0.014 0.905 Robust LM (error) 1
1.209 0.271 Kelejian-Robinson (error) 8
8.848 0.355 Lagrange Multiplier (lag) 1
4.981 0.026 Robust LM (lag) 1 6.176 0.013
Lagrange Multiplier (SARMA) 2 6.190 0.045
15
- Spatial Lag Model
- The weighted average effect of the values from
contiguous counties to Countyi - Model y ?Wy X? ? ? N ( 0, ?2In )
- Spatial Error Model
- The weighted average effect of the errors from
contiguous counties to Countyi - Model y X? u
- u ?Wu ? ? N ( 0, ?2In )
- General Spatial Model
- y ?Wy X? u
- u ?Wu ? ? N ( 0, ?2In )
16
An Example of SAR-ML Regression Results
- Variable Coeff Z-value P-value
- Spatial lag (?) 0.273 2.396 0.017
- Constant 9.526 0.035 0.972
- Farm income 1.379 2.477 0.013
- Farm size -0.079 -0.263 0.793
- Farm investment 3.040 3.675 0.000
- Land use change 120.875 2.009 0.044
- Population density 1.932 5.084 0.000
- Metropolitan 214.556 2.942 0.003
- Log-likelihood - 454.6 n67
17
Future Research
- Socio-economic and environmental impact of land
use change in the South - Land use and micro-climate variability
- Urbanization and externalities to the environment
- Land values, hedonic models
18
- Methodology (Extensive use of spatial analytical
tools) - Data sources includes (not limited to)
- USGS USDA Population Census USFS
- GIS analysis
- Impact zones
- Area measurement
- Spatial Analysis
- Spatial weight based statistical models
- Multivariate regression models
19
- COMMENTS ?
- SUGGESTIONS ?
- I am here to learn from you!
Recommended
CrystalGraphics Presentations


