
Table 1 GDP and Its Components - PowerPoint PPT Presentation
1 / 7
Title:
Table 1 GDP and Its Components
Description:
Figure 2 Real GDP in the United States. Billions of. 2000 Dollars $10,000. 9,000. 8,000 ... us the income and expenditure of the average person in the economy. ... – PowerPoint PPT presentation
Number of Views:28
Avg rating:3.0/5.0
Title: Table 1 GDP and Its Components
1
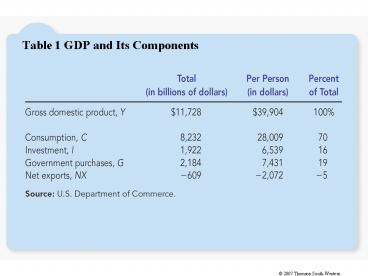
Table 1 GDP and Its Components
2
GDP and Its Components (2004)
3
(No Transcript)
4
Figure 2 Real GDP in the United States
Billions of
2000 Dollars
10,000
9,000
8,000
7,000
6,000
5,000
4,000
3,000
2,000
1970
1975
1980
1985
1990
2000
1995
2005
5
IS GDP A GOOD MEASURE OF ECONOMIC WELL-BEING?
- GDP is the best single measure of the economic
well-being of a society. - GDP per person tells us the income and
expenditure of the average person in the economy.
- Higher GDP per person indicates a higher standard
of living. - GDP is not a perfect measure of the happiness or
quality of life, however.
6
GDP AND ECONOMIC WELL-BEING
- Some things that contribute to well-being are not
included in GDP. - The value of leisure.
- The value of a clean environment.
- The value of almost all activity that takes place
outside of markets, such as the value of the time
parents spend with their children and the value
of volunteer work.
7
Table 3 GDP and the Quality of Life
Recommended
CrystalGraphics Presentations


