Title of Slisd de Here - PowerPoint PPT Presentation
1 / 29
Title:
Title of Slisd de Here
Description:
transit/pedestrian-oriented development patterns for future growth ... Central area, mix of housing (e.g. Glebe) Central area, apts/ condos (e.g. Centretown) ... – PowerPoint PPT presentation
Number of Views:38
Avg rating:3.0/5.0
Title: Title of Slisd de Here
1
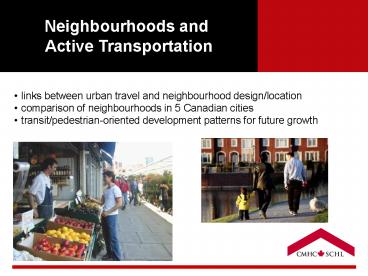
Neighbourhoods and Active Transportation
- links between urban travel and neighbourhood
design/location - comparison of neighbourhoods in 5 Canadian cities
- transit/pedestrian-oriented development patterns
for future growth
2
- Tool estimates vehicle km traveled for weekday
trips based on neighbourhood design, demographics
and location
3
Estimated annual distance driven for weekday
urban trips 10,000 km per household
Central area, compact, mixed-use
Outer suburbs, single-use
Estimated annual distance driven for weekday
urban trips 25,000 km per household
4
- How do real neighbourhoods compare?
- 5 Canadian cities Ottawa, Montreal, Vancouver,
Calgary and Toronto - 6 types of neighbourhoods
central area, mostly apartments
inner suburbs, mostly single-detached
inner suburbs, mixed housing
central area, mixed housing
outer suburbs, mostly single-detached
outer suburbs, mixed housing
5
3 zones Central area, Inner suburbs, Outer
suburbs
6
Proximity to daily destinations
Data CanMapR Streetfiles V6.3 and the 2001
Census, Statistics Canada.
7
Estimated vehicle km traveled for weekday urban
trips
8
Estimated vehicles per household
9
Monthly housing costs
Data 2001 Census, Statistics Canada
9,000/year to own and operate a vehicle
10
(No Transcript)
11
- Solutions for future growth
Intensification
Pedestrian / transit-friendly greenfield
development
12
- What is residential intensification?
- housing development in existing urban areas
- Different forms
- infill (small lots, lot splitting, laneways)
- adaptive reuse
- addition (e.g. secondary suites)
13
- Brownfield redevelopment
- contaminated industrial or commercial properties
14
- Greyfield redevelopment
- underutilized commercial centres - shopping
malls, strip malls or retail plazas - and their
parking lots
15
- Why intensify?
- makes transit and walking more viable
- -impacts health, air quality, climate change,
occupant costs - reduces infrastructure costs
- preserves farmland, natural areas
- revitalizes urban areas in decline
16
- CMHC Case Studies
- insights into challenges and solutions
- interviewed developers, occupants, municipal
planners - 54 case studies of built projects and municipal
initiatives that encouraged intensification
After
Before
17
More pedestrian-friendly, efficient new
greenfield developments
Drawing adapted from Canadian Geographic, July
2005
18
1 km as crow flies, 2 km pedestrian route
19
From Portland grid to rectangular grid
Portland grid
Delete every 2nd street
25 blocks
15 blocks
- a 13 increase in buildable area
- fewer 4-way intersections
- still good connectivity
20
Remove streets, create loops
- Streets
- 35
- 27
Lots 65 73
16 more buildable area
Added bonus Traffic Calming
21
Remove streets, create cul-de-sacs
- Streets
- 35
- 24
Lots 65 76
from 43 to 24 in ROWs 19 more buildable area
Added bonus Traffic Calming
22
Distributing Access and Traffic
Added bonus More Traffic Calming
23
Add greenspace for connectivity, views, delight.
Open space 8.7
24
Open space 9.5
25
Open space 11.7
Open space 11.7
26
- Fitting the blocks together
27
(No Transcript)
28
Where is it being applied?
- Approved plans in
- Stratford, Ontario
- Regina
- Fort McMurray
- Calgary
29
- For more information
- www.cmhc.ca
- your municipality
- provincial ministry of municipal affairs
- smart growth networks Canada, BC, Ontario
- Heart and Stroke Foundation of Canada
- Vivre en Ville


