
Falling Wedge Pattern (1)
Title:
Falling Wedge Pattern (1)
Description:
A Falling Wedge is a chart pattern that looks like a narrowing downward slope. It usually means a stock is going down for a while—but not for long. When this pattern shows up, it often signals that the price might reverse and start going up soon. Traders see it as a bullish sign, especially if volume increases when the breakout happens. –
Number of Views:1
Title: Falling Wedge Pattern (1)
1
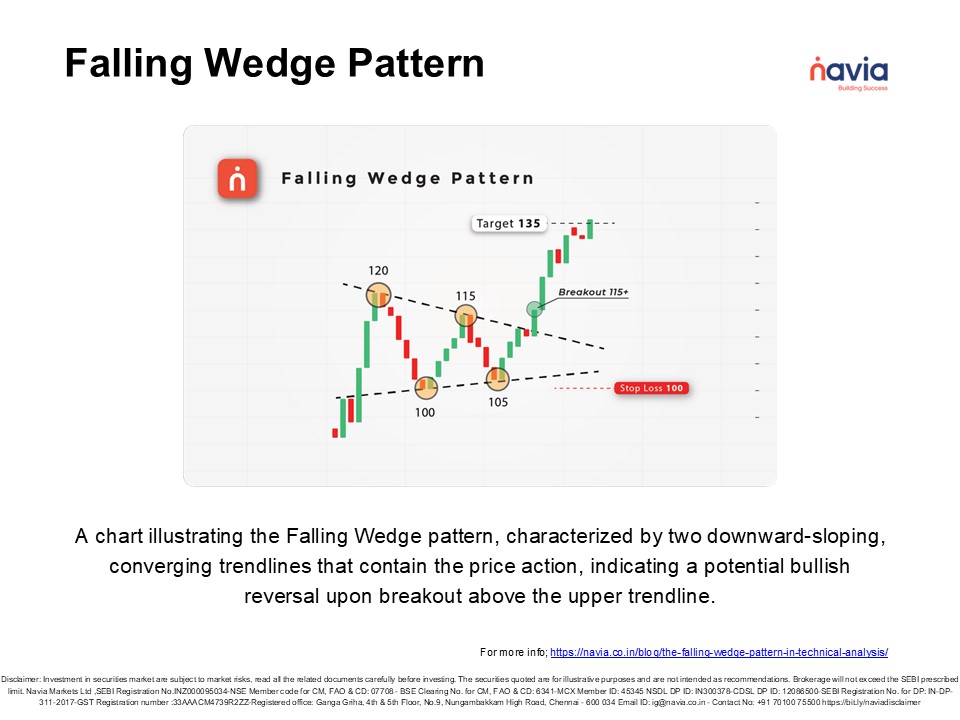
Falling Wedge Pattern
A chart illustrating the Falling Wedge pattern,
characterized by two downward-sloping, converging
trendlines that contain the price action,
indicating a potential bullish reversal upon
breakout above the upper trendline.
For more info https//navia.co.in/blog/the-fallin
g-wedge-pattern-in-technical-analysis/
Disclaimer Investment in securities market are
subject to market risks, read all the related
documents carefully before investing. The
securities quoted are for illustrative purposes
and are not intended as recommendations.
Brokerage will not exceed the SEBI prescribed
limit. Navia Markets Ltd ,SEBI Registration
No.INZ000095034-NSE Member code for CM, FAO CD
07708 - BSE Clearing No. for CM, FAO CD
6341-MCX Member ID 45345 NSDL DP ID
IN300378-CDSL DP ID 12086500-SEBI Registration
No. for DP IN-DP-311-2017-GST Registration
number 33AAACM4739R2ZZ-Registered office Ganga
Griha, 4th 5th Floor, No.9, Nungambakkam High
Road, Chennai - 600 034 Email ID ig_at_navia.co.in
- Contact No 91 70100 75500 https//bit.ly/navia
disclaimer
Recommended
CrystalGraphics Presentations


