
3.2 Business-Data-Analytics-Unveiling-Insights - PowerPoint PPT Presentation
Title:
3.2 Business-Data-Analytics-Unveiling-Insights
Description:
Business Data Analytics – PowerPoint PPT presentation
Number of Views:1
Date added: 2 March 2025
Slides: 11
Provided by:
jitendratomar
Category:
How To, Education & Training
Tags:
Title: 3.2 Business-Data-Analytics-Unveiling-Insights
1
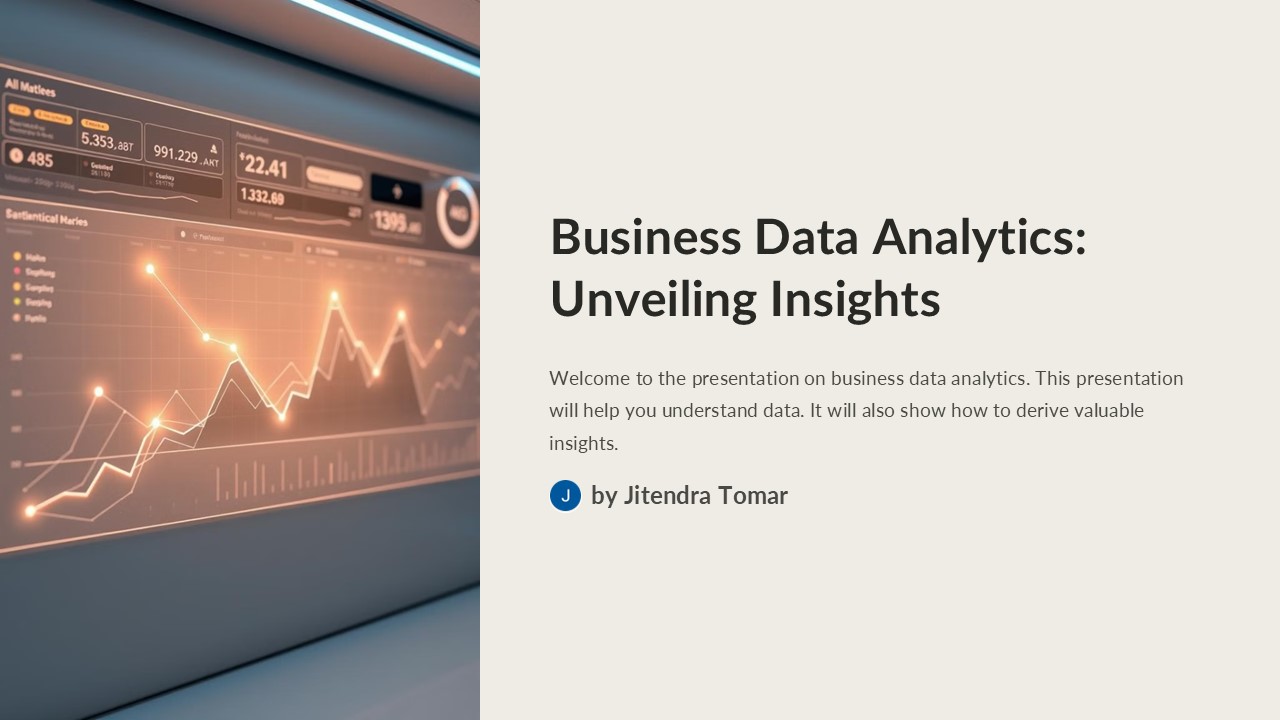
Business Data Analytics Unveiling Insights
Welcome to the presentation on business data
analytics. This presentation will help you
understand data. It will also show how to derive
valuable insights.
by Jitendra Tomar
2
Exploratory Data Analysis Discovering Patterns
Exploratory Data Analysis helps reveal data
patterns and is key to forming a better
understanding of the dataset. EDA also helps
generate hypotheses for further testing and
validation.
Data Cleaning
Visualization
Handle missing values by imputation or removal.
Identify and correct errors in data entry and
collection. Standardize formats to ensure
consistency.
Understand data with graphs and charts, including
histograms, scatter plots, and box plots. Explore
distributions and relationships between variables
using visual aids.
3
EDA Techniques Visualizations and Statistics
Visualizations and stats help understand data.
Charts summarize and display the information.
Statistics offer another important perspective.
Histograms
Scatter Plots
Pie Charts
Visualize distributions to understand the
frequency of data points within specific ranges,
revealing patterns like skewness and outliers.
Show relationships between two variables, helping
to identify correlations, clusters, and potential
outliers in the data.
Show proportions and percentages of different
categories within a dataset, making it easy to
compare relative sizes of different segments.
4
Regression Analysis Modeling Relationships
Regression Analysis helps model relationships.
Determine how variables impact each other. Useful
in predicting outcomes and trends. Regression
analysis is a powerful tool for understanding
relationships, identifying key drivers, and
making predictions based on historical data.
Collect Data
Gather relevant data from various sources to
ensure a comprehensive and representative dataset.
Choose Model
Select an appropriate regression model based on
the nature of the relationship between variables
and the type of outcome being predicted.
Analyze Results
Interpret regression coefficients, assess model
fit, and validate findings to ensure the accuracy
and reliability of the analysis.
5
Regression Types Linear and Multiple Regression
Two main types of regression are shown. Linear
regression looks at one independent variable.
Multiple regression considers many inputs.
Linear Regression
Multiple Regression
One independent variable. Linear regression
models the relationship between a single
independent variable and a dependent variable by
fitting a linear equation to the observed data.
This simple yet powerful technique is widely used
for predicting outcomes and understanding the
magnitude and direction of the effect that
changes in the independent variable have on the
dependent variable.
Multiple independent variables. Multiple
regression extends linear regression to scenarios
with two or more independent variables, allowing
for a more nuanced analysis of complex
relationships. By considering multiple predictors
simultaneously, multiple regression can account
for the unique contribution of each variable
while controlling for the effects of others,
providing a more comprehensive understanding of
the factors influencing the dependent variable.
6
Time Series Forecasting Predicting the Future
Time Series Forecasting anticipates future values
by analyzing historical data. It focuses on data
points indexed in time, making it invaluable for
various applications. Common applications include
sales forecasting, stock price prediction, and
weather forecasting. Time series forecasting
provides insights for proactive decision-making.
Data Collection
1
Gather historical data relevant to the variable
you want to forecast. Ensure the data is clean,
accurate, and properly time-stamped.
Model Selection
2
Choose an appropriate forecasting model based on
the characteristics of your data, such as trend,
seasonality, and noise. Common models include
ARIMA, Exponential Smoothing, and Prophet.
Forecasting
3
Apply the selected model to the historical data
to generate future predictions. Evaluate the
accuracy of the forecasts using appropriate
metrics and refine the model as needed.
7
Time Series Components Trend, Seasonality, Noise
Time series data comprises three key elements
trend, seasonality, and noise. Recognizing these
components is vital for effective analysis and
forecasting. Here's a concise overview
Seasonality
Seasonality denotes regular, predictable patterns
within fixed periods (daily, weekly, monthly,
yearly), often influenced by weather or cycles.
Recognizing seasonality is crucial for short-term
forecasting and understanding recurring
fluctuations.
2
Trend
The trend indicates the data's long-term
directionincreasing, decreasing, or constant.
Identifying the trend aids in grasping overall
data behavior and making long-term forecasts.
1
Noise
Noise represents random, unpredictable
fluctuations not linked to trend or seasonality,
including irregular variations or outliers.
Managing noise enhances the accuracy and
reliability of time series analysis.
3
8
Lifetime Value (LTV) Models Understanding
Customer Worth
LTV Models estimate the total revenue a customer
will bring. Important for customer acquisition
and retention. Helps make informed marketing
decisions.
Predict future profits
1
Forecast the revenue expected from a customer
relationship, enabling better investment planning.
Estimate churn rate
2
Determine the rate at which customers discontinue
their relationship with the company to identify
at-risk customers.
Calculate customer value
3
Quantify the total value a customer brings to the
business, factoring in revenue, costs, and the
time value of money.
9
LTV Calculation Methods and Metrics
Various metrics can be used to calculate LTV.
Average purchase value and purchase frequency.
Customer lifespan is another important component.
5
50
Years
Avg Purchase
Average customer lifespan
Average purchase value
4
Purchases/Year
Yearly Purchases
10
Applications and Conclusion Driving
Data-Informed Decisions
Business data analytics is pivotal for informed
decision-making in modern organizations.
Leveraging data-driven insights leads to superior
results across various business functions.
Embracing analytics enables businesses to refine
strategies, enhance operational efficiency, and
gain a competitive edge. This analytical approach
fosters a culture of continuous improvement and
innovation.
Strategic Planning
1
Use analytics for strategic planning to identify
market trends, assess competitive landscapes, and
forecast future opportunities, ensuring that
business strategies are aligned with
data-supported insights.
Operational Efficiency
2
Improve operational efficiency by employing data
analytics to optimize processes, reduce costs,
and enhance productivity, leading to significant
improvements in overall business performance.
Recommended
CrystalGraphics Presentations


