
data analytics syllabus - PowerPoint PPT Presentation
Title:
data analytics syllabus
Description:
Data Analytics Syllabus by Data Analytics Masters This blog outlines the comprehensive syllabus for the Data Analytics Masters course. It covers key topics such as: Data collection, preparation, and cleaning Statistical concepts and hypothesis testing Exploratory data analysis and visualization Machine learning basics and advanced techniques Big data analytics and real-time processing Ethical considerations in data handling Industry applications in healthcare, finance, marketing, and more This syllabus provides a clear path for mastering data analytics and applying these skills in various industries. – PowerPoint PPT presentation
Number of Views:0
Date added: 1 March 2025
Slides: 6
Provided by:
dataanalyticsmasters
Category:
How To, Education & Training
Tags:
Title: data analytics syllabus
1
Data Analytics Syllabus
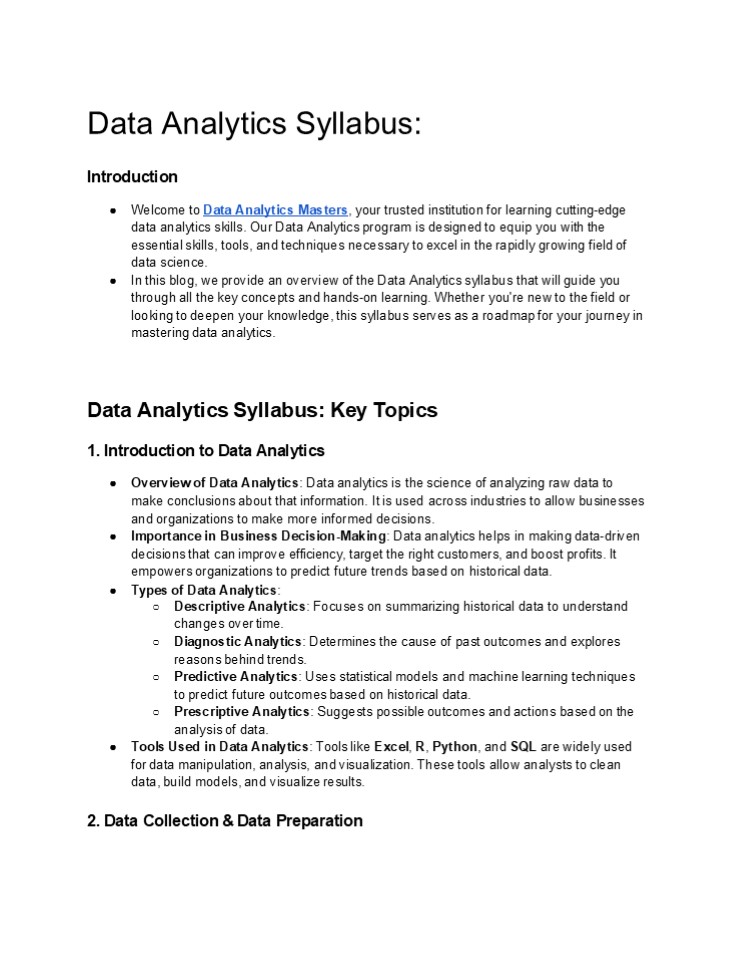
- Introduction
- Welcome to Data Analytics Masters, your trusted
institution for learning cutting-edge data
analytics skills. Our Data Analytics program is
designed to equip you with the essential skills,
tools, and techniques necessary to excel in the
rapidly growing field of data science. - In this blog, we provide an overview of the Data
Analytics syllabus that will guide you through
all the key concepts and hands-on learning.
Whether you're new to the field or looking to
deepen your knowledge, this syllabus serves as a
roadmap for your journey in mastering data
analytics.
- Data Analytics Syllabus Key Topics
- Introduction to Data Analytics
- Overview of Data Analytics Data analytics is the
science of analyzing raw data to make conclusions
about that information. It is used across
industries to allow businesses and organizations
to make more informed decisions. - Importance in Business Decision-Making Data
analytics helps in making data-driven decisions
that can improve efficiency, target the right
customers, and boost profits. It empowers
organizations to predict future trends based on
historical data. - Types of Data Analytics
- Descriptive Analytics Focuses on summarizing
historical data to understand changes over time. - Diagnostic Analytics Determines the cause of
past outcomes and explores reasons behind trends. - Predictive Analytics Uses statistical models and
machine learning techniques to predict future
outcomes based on historical data. - Prescriptive Analytics Suggests possible
outcomes and actions based on the analysis of
data. - Tools Used in Data Analytics Tools like Excel,
R, Python, and SQL are widely used for data
manipulation, analysis, and visualization. These
tools allow analysts to clean data, build models,
and visualize results. - Data Collection Data Preparation
2
- Data Collection Methods Data can be gathered
from various sources, such as surveys, web
scraping, APIs, and databases. Each method has
its strengths and weaknesses, depending on the
data's nature. - Data Cleaning The raw data collected is often
messy. Cleaning involves handling missing values,
removing duplicate entries, fixing errors, and
transforming data into a consistent format. - Data Transformation Transformation techniques
like aggregation, normalization, and encoding
help prepare data for further analysis. It also
involves changing the data's format to fit the
needs of the model. - Data Structuring and Formatting Data can be
structured in different formats, such as CSV,
JSON, or stored in relational databases like SQL.
Proper structuring helps ensure smooth data
analysis processes. - Statistical Foundations
- Introduction to Statistics Basic statistical
concepts like mean, median, mode, variance, and
standard deviation form the foundation of data
analytics. These help summarize and interpret
datasets. - Probability Theory Probability helps predict the
likelihood of different outcomes. Understanding
distributions like Normal, Binomial, and Poisson
distributions is key to modeling. - Hypothesis Testing Statistical tests such as
t-tests, chi-square tests, and ANOVA are used to
test assumptions or hypotheses about the data and
determine the statistical significance of
results. - Correlation and Causation Understanding the
relationship between variables is essential. The
Pearson correlation coefficient measures linear
relationships, while distinguishing between
correlation and causation is crucial to avoid
faulty conclusions. - Exploratory Data Analysis (EDA)
- Visualizing Data Visualization helps to quickly
identify patterns, trends, and anomalies. Common
charts include histograms (distribution),
boxplots (outliers), and scatterplots
(correlations). - Summary Statistics Measures like mean, median,
mode, and standard deviation help summarize data.
EDA gives insights into the data's distribution,
central tendencies, and spread. - Identifying Outliers Outliers can significantly
affect the results of an analysis. Methods like
Z-scores or the Interquartile Range (IQR) help
identify data points that deviate from the normal
distribution. - Data Patterns and Trends By exploring the data,
analysts can uncover important trends, patterns,
and relationships that can lead to valuable
insights. - Data Visualization
3
- Importance of Data Visualization Data
visualization plays a key role in presenting
complex data in a visual format that is easy to
understand. It helps uncover insights and
communicate results effectively. - Popular Visualization Tools
- Tableau and Power BI are popular for creating
interactive dashboards. - Matplotlib and Seaborn in Python help create
various plots and graphs for static
visualizations. - Creating Interactive Dashboards and Reports
Building dashboards that display real-time data
is important for businesses to monitor key
performance indicators (KPIs) and make quick
decisions. - Key Visualization Types Visualizations like bar
charts (comparison), line charts (trends over
time), and heatmaps (data density) are frequently
used to illustrate different data insights. - Data Modeling Machine Learning Basics
- Introduction to Predictive Analytics Predictive
analytics uses historical data to predict future
events. It is often powered by machine learning
models that can identify trends in data. - Basic Algorithms
- Linear Regression A statistical method to model
the relationship between dependent and
independent variables. - Logistic Regression Used for binary
classification tasks (e.g., yes/no, 1/0). - K-Nearest Neighbors (KNN) A classification
algorithm that makes predictions based on the
majority class of the nearest neighbors. - Supervised vs Unsupervised Learning
- Supervised Learning The model is trained on
labeled data (input-output pairs). - Unsupervised Learning The model learns patterns
from data that isn't labeled, such as clustering. - Model Evaluation Metrics Evaluating model
performance with metrics like accuracy,
precision, recall, and F1-score helps ensure the
model's validity. - Advanced Analytics Techniques
4
- Introduction to Neural Networks and Deep
Learning Deep learning models, such as
Convolutional Neural Networks (CNNs) and
Recurrent Neural Networks (RNNs), are used for
complex data tasks like image classification and
natural language processing (NLP). - Big Data Analytics
- Introduction to Big Data and Hadoop Big Data
refers to datasets too large or complex for
traditional data-processing tools. Hadoop is a
framework that allows for distributed storage and
processing of large datasets. - Understanding NoSQL Databases Unlike traditional
SQL databases, NoSQL databases like MongoDB and
Cassandra are designed to handle large-scale,
unstructured data. - Real-time Data Analytics Tools like Apache Kafka
and Apache Spark enable real-time data
processing, allowing businesses to act
immediately on incoming data. - Distributed Data Processing Distributed systems
allow processing of data across multiple
machines, making it scalable and faster to
analyze big datasets. - Ethics in Data Analytics
- Data Privacy and Security Adhering to
regulations like GDPR and HIPAA is essential to
protect individuals privacy and data. Ethical
data handling practices must be followed to avoid
misuse. - Ethical Considerations in Data Analysis Data
analysts must ensure that their findings are
objective and unbiased. Ethical challenges may
arise, such as data manipulation or presenting
misleading insights. - Avoiding Bias in Data Models Bias in data models
can lead to unfair or discriminatory outcomes.
Techniques for ensuring fairness and mitigating
bias are crucial in data analysis. - Responsible Reporting of Analytics Findings It
is important to present data findings
responsibly, ensuring the conclusions drawn are
supported by the data and don't mislead the
audience. - Data Analytics in Different Industries
- Data Analytics in Healthcare, Finance, Marketing,
and E-commerce Data analytics has specific
applications in various industries - In healthcare, its used to improve patient care
and operational efficiency. - In finance, it helps detect fraud and make
investment predictions. - In marketing, analytics helps optimize customer
targeting and campaign strategies.
5
- Case Studies and Applications Real-world case
studies demonstrate how companies have
successfully applied data analytics to improve
their operations and - decision-making.
- Real-World Examples and Projects Hands-on
projects provide practical experience with real
data, helping to apply the concepts learned in
the course. - Conclusion
- Mastering the topics outlined in this syllabus
will equip you with the foundational knowledge
and technical skills required to become
proficient in data analytics. - Whether you're seeking a career in data science,
business analysis, or any other data-driven role,
this syllabus provides a comprehensive roadmap
for your learning journey. - Ready to start your data analytics journey with
us? - Join Data Analytics Masters today and equip
yourself with the skills to shape the future!
Recommended
CrystalGraphics Presentations


