
The Importance of Resizing Pie Charts in PowerPoint - PowerPoint PPT Presentation
Title:
The Importance of Resizing Pie Charts in PowerPoint
Description:
Resizing a pie chart in PowerPoint is easy and can improve your presentation's look. To resize, click on the chart and drag its corners. To change colors, right-click the chart, select "Format Data Series," and choose a fill color. If you want to highlight specific slices, click on a slice and use the "Explode" feature to separate it from the rest. To edit the data, click the chart, go to "Chart Tools," and select "Edit Data" to change values in the spreadsheet. You can also add animations for more engagement by selecting the chart and going to the "Animations" tab to pick different effects for how the segments appear. These steps help ensure your pie chart effectively presents data while keeping the audience's attention for a more impactful presentation. – PowerPoint PPT presentation
Number of Views:0
Date added: 19 February 2025
Slides: 3
Provided by:
visualsculptors
Category:
How To, Education & Training
Tags:
Title: The Importance of Resizing Pie Charts in PowerPoint
1
Data Visualization Charts, Graphs and
Infographic designs - MS Graph Common Questions
Answered
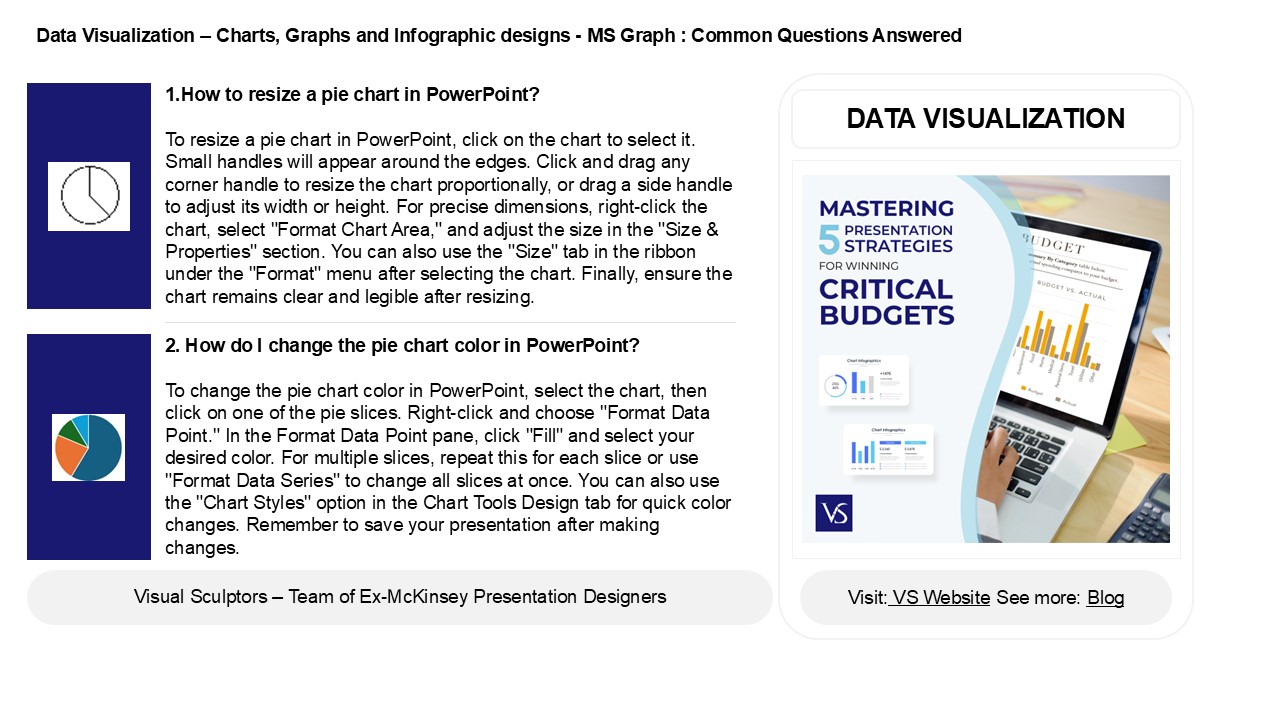
- 1.How to resize a pie chart in PowerPoint?
- To resize a pie chart in PowerPoint, click on the
chart to select it. Small handles will appear
around the edges. Click and drag any corner
handle to resize the chart proportionally, or
drag a side handle to adjust its width or height.
For precise dimensions, right-click the chart,
select "Format Chart Area," and adjust the size
in the "Size Properties" section. You can also
use the "Size" tab in the ribbon under the
"Format" menu after selecting the chart. Finally,
ensure the chart remains clear and legible after
resizing.
DATA VISUALIZATION
2. How do I change the pie chart color in
PowerPoint? To change the pie chart color in
PowerPoint, select the chart, then click on one
of the pie slices. Right-click and choose "Format
Data Point." In the Format Data Point pane, click
"Fill" and select your desired color. For
multiple slices, repeat this for each slice or
use "Format Data Series" to change all slices at
once. You can also use the "Chart Styles" option
in the Chart Tools Design tab for quick color
changes. Remember to save your presentation after
making changes.
2
Data Visualization Charts, Graphs and
Infographic designs - MS Graph Common Questions
Answered
3. How to split a pie chart in PowerPoint? To
split a pie chart in PowerPoint, first create
your pie chart by selecting your data and
inserting a chart. Then, click on the pie chart
to activate it. Right-click on the pie slice you
want to separate and select "Format Data Series."
In the options, adjust the "Angle of first slice"
to reposition slices or increase the "Explosion"
value to separate the slice from the rest. For
further customization, you can change colors and
add labels as needed. Finally, ensure to save
your presentation to keep the changes.
4. How do I edit data in a pie chart in
PowerPoint? To edit data in a pie chart in
PowerPoint, first click on the chart to select
it. Then, click on the "Chart Design" tab in the
ribbon and select "Edit Data." This will open an
Excel spreadsheet where you can modify the values
or labels. After making your changes, close the
Excel window, and the pie chart in PowerPoint
will automatically update to reflect the new
data. Remember to save your presentation
afterward to keep the changes.
5. Can you animate a pie chart in PowerPoint?
Yes, you can animate a pie chart in PowerPoint.
To do this, insert the pie chart using the
"Insert" tab, then select the chart. Go to the
"Animations" tab, choose an animation effect such
as "Wipe" or "Appear," and customize the
animation settings. You can animate individual
slices by selecting "Effect Options" and choosing
"By Element." Adjust the timing and order in the
Animation Pane for a dynamic presentation.
Recommended
CrystalGraphics Presentations


