
Network Evolution - PowerPoint PPT Presentation
1 / 16
Title:
Network Evolution
Description:
Combine a set of networks to one large network. Network Description and ... turned off (biological meaningless) Tautology: Always turned on (household genes) ... – PowerPoint PPT presentation
Number of Views:65
Avg rating:3.0/5.0
Title: Network Evolution
1
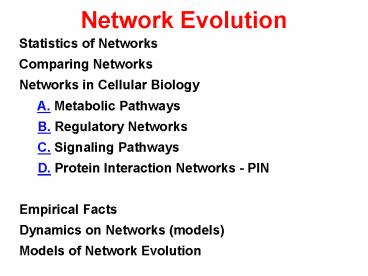
Network Evolution
Statistics of Networks Comparing Networks
Networks in Cellular Biology A. Metabolic
Pathways B. Regulatory Networks C.
Signaling Pathways D. Protein Interaction
Networks - PIN Empirical Facts Dynamics on
Networks (models) Models of Network Evolution
2
Network Alignment Motifs Barabasi Oltvai,
2004, Sharan Ideker, 2006
- Are nodes/edges labelled?
- Which operations are allowed?
- Pair/Multiple?
3
Network Description and Statistics I Barabasi
Oltvai, 2004
- Degree Distribution - P(k)
- Scale Free Networks P(k)k-g ggt2
- Hubs multiply connected nodes
- The lower g, the more hubs.
- Small World Property
- Graph connected and path lengths small
Remade from Barabasi, 2004
4
Network Description and Statistics II Barabasi
Oltvai, 2004
5
A. Metabolic Pathways
- Flux Analysis
- Metabolic Control Theory
- Biochemical Systems Theory
- Kinetic Modeling
6
Control Coefficients (Heinrich Schuster
Regulation of Cellular Systems. 1996)
Flux Control Coeffecient FCC
FCF gluconeogenesis from lactate Pyruvate
transport .01 Pyruvate
carboxylase
.83 Oxaloacetate transport
.04 PEOCK
.08
7
A Model for Network Inference
- A given set of possible reactions -
- arrows not shown.
- A set of present reactions - M
- black and red arrows
- Let m be the rate of deletion
- l the rate of insertion
- Then
8
Likelihood of Homologous Pathways
9
B. Regulatory Networks
Remade from Somogyi Sniegoski,96. F2
10
Boolen functions, Wiring Diagrams and Trajectories
Remade from Somogyi Sniegoski,96. F4
11
Boolean Networks R.Somogyi CA Sniegoski (1996)
Modelling the Complexity of Genetic Networks
Complexity 1.6.45-64.
Contradiction Always turned off (biological
meaningless) Tautology Always turned on
(household genes)
12
Reverse Engeneering Algorithm-Reveal Dhaeseler
et al.(2000) Genetic network Inference from
co-expression clustering to reverse engineering.
Bioinformatics 16.8.707-
0 1 1 1 1 0 0 0 1 1 0 1 1 1
1 0 1 0
Assumptions Discrete known Generations
No Noise
BOOL-1 Akutsu et al. (2000) Inferring qualitative
relations in genetic networks and metabolic
pathways. Bioinformatics 16.2.727-
Algorithm For each gene do (n) For each
boolean rule (lt k inputs) not violated, keep it.
If O(22k2k alog(n)) INPUT patterns are given
uniformly randomly, BOOL-1 correctly identifies
the underlying network with probability 1-n-a,
where a is any fixed real number gt 1.
13
C. Signaling Pathways
- Transmits signals from membrane to gene
regulation. - Its function is enigmatic as some of the
molecules involved are common to different
functions and how cross-interaction is avoided is
unknown.
www.hprd.org from Pierre deMeyts
14
D. Protein Interaction Network
- The sticking together of different protein is
measured by mass spectroscopy. - The nodes will be all known proteins.
- Two nodes are connected if they stick together.
This can be indicator of being part of a a
functional protein complex, but can also occur
for other reasons.
15
PIN Network Evolution Barabasi Oltvai, 2004
Berg et al. ,2004 Wiuf etal., 2006
- Berg et al. ,2004
- Gene duplication slow 10-9/year
- Connection evolution fast 10-6/year
- Observed networks can be modeled as if node
number was fixed.
16
Likelihood of PINs
- Can only handle 1 graph.
- Limited Evolution Model
Recommended
CrystalGraphics Presentations


