
CUAHSIHydrologic Information Systems - PowerPoint PPT Presentation
Title:
CUAHSIHydrologic Information Systems
Description:
CUAHSI HIS Project Team. Information Sources. Modeling, Analysis and Visualization ... Windows, Unix, Linux, Mac. Internet. CUAHSI Hydrologic Data Access System ... – PowerPoint PPT presentation
Number of Views:73
Avg rating:3.0/5.0
Title: CUAHSIHydrologic Information Systems
1
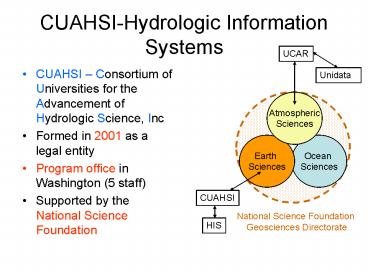
CUAHSI-Hydrologic Information Systems
UCAR
- CUAHSI Consortium of Universities for the
Advancement of Hydrologic Science, Inc - Formed in 2001 as a legal entity
- Program office in Washington (5 staff)
- Supported by the National Science Foundation
Unidata
Atmospheric Sciences
Ocean Sciences
Earth Sciences
CUAHSI
National Science Foundation Geosciences
Directorate
HIS
2
CUAHSI Member Institutions
115 Universities as of August 2006
3
CUAHSI Mission To provide infrastructure and
services to advance the development of hydrologic
science and education
4
Common Vision WATERS Network
Informatics
Observatories/ Environmental Field Facilities
Sensors and Measurement Facility
Synthesis
A combined CLEANER-CUAHSI effort
5
(No Transcript)
6
Definition
- The CUAHSI Hydrologic Information System (HIS) is
a geographically distributed network of
hydrologic data sources and functions that are
integrated using web services so that they
function as a connected whole.
7
Goals
- better Data Access
- support for Hydrologic Observatories
- advancement of Hydrologic Science
- enabling Hydrologic Education
8
CUAHSI HIS Project Team
9
CUAHSI Hydrologic Information System
Experiments
Monitoring
1. Assemble data from many sources
Information Sources
GIS
Remote sensing
Climate models
2. Integrate data into a coherent structure
Hydrologic Information Model
Modeling, Analysis and Visualization
3. Do science
Hypothesis testing
Statistics
Simulation
Data Assimilation
10
HIS User Assessment
- First survey done for HIS White Paper (2003)
- HIS Symposium in March 4 institutional surveys
and a survey of participants - CUAHSI Web Surveyor online questionnaire (75
responses from 38 institutions) - Summary paper
11
Please rank these four HIS service categories for
helping you.
Value Score (counting 4 for first, 4 for second,
2 for third and 1 for fourth).
Conclusion Data services are the highest
priority
12
of time spent preparing data
13
- Which operating systems do you use for your
research? If you use more than one operating
system, select all that apply.
14
Please indicate one dataset that you believe
would most benefit from increased ease of access
through a Hydrologic Information System (HIS).
Conclusion EPA STORET Water Quality, Streamflow
and Remote Sensing Data are perceived to be able
to benefit from improved access.
I am surprised USGS streamflow is up there. Is
this an indication of importance over difficulty?
15
How we use software (Austin Symposium)
16
Which of the following data analysis difficulties
are most important for HIS to address?
Conclusion High priorities are - Data
formats - Metadata - Irregular time steps
Value Score (counting 3 for first, 2 for second
and 1 for third).
17
How we use software (Web Surveyor)
- Programming (85 of respondents) Fortran, C/C,
Visual Basic - Data Management (93) Excel, MS Access
- GIS (93) ArcGIS
- Mathematics/Statistics (98) Excel, Matlab, SAS,
variety of other systems - Hydrologic models (80) Modflow, HEC models
- A general, simple, standard, and open interface
that could connect with many systems is the only
way to accommodate all these
18
Water Data
Water quantity and quality
Rainfall Snow
Soil water
Modeling
Meteorology
Remote sensing
19
Water Data Web Sites
20
Digital Watershed
How can hydrologists integrate observed and
modeled data from various sources into a single
description of the environment?
A digital watershed is a synthesis of hydrologic
observation data, geospatial data, remote
sensing data and weather and climate data into a
connected database for a hydrologic region
21
Downloads
Uploads
HTML -XML
Data access through web services
WaterOneFlow Web Services
WSDL - SOAP
Data storage through web services
22
Applications and Services
Web application Data Portal
- Your application
- Excel, ArcGIS, Matlab
- Fortran, C/C, Visual Basic
- Hydrologic model
- .
- Your operating system
- Windows, Unix, Linux, Mac
Internet
Web Services Library
23
CUAHSI Hydrologic Data Access System
http//river.sdsc.edu/HDAS
NASA
NCDC
EPA
NWS
Observatory Data
USGS
Arc Hydro Server will be a customization of
ArcGIS Server 9.2 for serving water observational
data
A common data window for accessing, viewing and
downloading hydrologic information
24
Utah State University Streamflow Analyst
25
Data Sources
NASA
Storet
Ameriflux
Unidata
NCDC
Extract
NWIS
NCAR
Transform
CUAHSI Web Services
Excel
Visual Basic
ArcGIS
C/C
Load
Matlab
Fortran
Access
Java
Applications
Some operational services
http//www.cuahsi.org/his/
26
CUAHSI Hydrologic Information System Levels
National HIS San Diego Supercomputer Center
Map interface, observations catalogs and web
services for national data sources integration
of information from workgroups
HIS Server
Map interface, observations catalogs and web
services for regional data sources observations
databases and web services for individual
investigator data
Personal HIS an individual hydrologic scientist
HIS Analyst
Application templates and HydroObjects for direct
ingestion of data into analysis environments
Excel, ArcGIS, Matlab, programming languages
MyDB for storage of analysis data
27
HIS Server
- Supports data discovery, delivery and publication
- Data discovery how do I find the data I want?
- Map interface and observations catalogs
- Metadata based Search
- Data delivery how do I acquire the data I want?
- Use web services or retrieve from local database
- Data Publication how do I publish my
observation data? - Use Observations Data Model
28
Observations Catalog
Specifies what variables are measured at each
site, over what time interval, and how many
observations of each variable are available
29
HIS Server Architecture
- Map front end ArcGIS Server 9.2 (being
programmed by ESRI Water Resources for CUAHSI) - Relational database SQL/Server 2005 or Express
- Web services library VB.Net programs accessed
as a Web Service Description Language (WSDL)
30
National and Workgroup HIS
National HIS
Workgroup HIS
National HIS has a polygon in it marking the
region of coverage of a workgroup HIS server
Workgroup HIS has local observations catalogs
for coverage of national data sources in its
region. These local catalogs are partitioned
from the national observations catalogs.
For HIS 1.0 the National and Workgroup HIS
servers will not be dynamically connected.
31
Hydrologic Science
It is as important to represent hydrologic
environments precisely with data as it is to
represent hydrologic processes with equations
Physical laws and principles (Mass, momentum,
energy, chemistry)
Hydrologic Process Science (Equations, simulation
models, prediction)
Hydrologic conditions (Fluxes, flows,
concentrations)
Hydrologic Information Science (Observations,
data models, visualization
Hydrologic environment (Dynamic earth)
32
Continuous Space-Time Model NetCDF (Unidata)
Time, T
Coordinate dimensions X
D
Space, L
Variable dimensions Y
Variables, V
33
Discrete Space-Time Data ModelArcHydro
Time, TSDateTime
TSValue
Space, FeatureID
Variables, TSTypeID
34
HydroVolumes
Take a watershed and extrude it vertically into
the atmosphere and subsurface A hydrovolume is
a volume in space through which water, energy
and mass flow, are stored internally, and
transformed
35
Watershed Hydrovolumes
Hydrovolume
Geovolume is the portion of a hydrovolume that
contains solid earth materials
USGS Gaging stations
36
Stream channel Hydrovolumes
37
Geospatial Time Series
Time Series Properties (Type)
A Value-Time array
A time series that knows what geographic feature
it describes and what type of time series it is
Shape
38
Terrain Data Models
Grid
TIN
Contour and flowline
39
Neuse Basin Coastal aquifer system
Section line
Beaufort Aquifer
From USGS, Water Resources Data Report of North
Carolina for WY 2002
40
Neuse Groundwater
Geovolumes of hydrogeologic units from US
Geological survey (GMS)
41
Create a 3 dimensional representation
Geovolume
Each cell in the 2D representation is transformed
into a 3D object
Geovolume with model cells
42
Page 3
The Demands
METADATA
Drexel University, College of Engineering
43
Page 21
Hydrologic Metadata
We currently have
What we need is
Michael Piasecki is our expert in this subject!
Ontology Examples
Drexel University, College of Engineering
44
CUAHSI Observations Data Model
- A relational database stored in Access,
PostgreSQL, SQLServer, . - Stores observation data made at points
- Access data through web interfaces
- Fill using automated data harvesting
Streamflow
Groundwater levels
Precipitation Climate
Soil moisture data
Flux tower data
Water Quality
45
Purposes
- Hydrologic Observations Data System to Enhance
- Retrieval
- Integrated Analysis
- Multiple Investigators
- Standard and Scalable Format for Sharing
- Ancillary information (metadata) to allow
unambiguous interpretation and use
incorporating uncertainty - Traceable heritage from raw measurements to
usable information quality control levels
Premise
- A relational database at the single observation
level (atomic model) - Querying capability
- Cross dimension retrieval and analysis
46
Community Design Requirements(from comments of
22 reviewers)
- Incorporate sufficient metadata to identify
provenance and give exact definition of data for
unambiguous interpretation - Spatial location of measurements
- Scale of measurements
- Depth/Offset Information
- Censored data
- Classification of data type to guide appropriate
interpretation - Continuous
- Indication of gaps
- Indicate data quality
47
Scale issues in the interpretation of data
The scale triplet
a) Extent
b) Spacing
c) Support
From Blöschl, G., (1996), Scale and Scaling in
Hydrology, Habilitationsschrift, Weiner
Mitteilungen Wasser Abwasser Gewasser, Wien, 346
p.
48
Hydrologic Observations Data Model
What are the basic attributes to be associated
with each single observation and how can these
best be organized?
See CUAHSI Community Hydrologic Observations Data
Model Working Design Specifications Document
http//www.cuahsi.org/his/documentation.html
49
Hydrologic Observations Data Model
What are the basic attributes to be associated
with each single observation and how can these
best be organized?
Data Source and Network
Controlled Vocabulary Tables
Sites
Variables
Values
Metadata
e.g. mg/kg, cfs
e.g. depth
Streamflow
Depth of snow pack
Landuse, Vegetation
e.g. Non-detect,Estimated,
Windspeed, Precipitation
A data source operates an observation network
A network is a set of observation sites
A site is a point location where one or more
variables are measured
A variable is a property describing the flow or
quality of water
A value is an observation of a variable at a
particular time
Metadata provide information about the context of
the observation.
Data Delivery
Data Discovery
See http//www.cuahsi.org/his/documentation.html
Ernest To Center for Research in Water
Resources University of Texas at Austin 20061011
50
Independent of, but coupled to Geographic
Representation
Arc Hydro
HODM
1
MonitoringPoint
1
SiteID
SiteCode
SiteName
OR
Latitude
Longitude
1
1
51
NHDPlus as a starting point for geographic
representation
- Slope
- Elevation
- Mean annual flow
- Corresponding velocity
- Drainage area
- of upstream drainage area in different land
uses - Stream order
52
Variable attributes
Cubic meters per second
L3/T
m3/s
VariableName, e.g. discharge VariableCode, e.g.
0060 SampleMedium, e.g. water Valuetype, e.g.
field observation, laboratory sample IsRegular,
e.g. Yes for regular or No for intermittent TimeSu
pport (averaging interval for observation) DataTyp
e, e.g. Continuous, Instantaneous,
Categorical GeneralCategory, e.g. Climate, Water
Quality NoDataValue, e.g. -9999
53
Data Types
- Continuous (Frequent sampling - fine spacing)
- Instantaneous (Spot sampling - coarse spacing)
- Cumulative
- Incremental
- Average
- Maximum
- Minimum
- Constant over Interval
- Categorical
54
Groups and Derived From Associations
55
Stage and Streamflow Example
56
Daily Average Discharge ExampleDaily Average
Discharge Derived from 15 Minute Discharge Data
57
Offset
OffsetValue Distance from a datum or control
point at which an observation was made OffsetType
defines the type of offset, e.g. distance below
water level, distance above ground surface, or
distance from bank of river
58
Water Chemistry from a profile in a lake
59
Methods and Samples
Method specifies the method whereby an
observation is measured, e.g. Streamflow using a
V notch weir, TDS using a Hydrolab, sample
collected in auto-sampler SampleID is used for
observations based on the laboratory analysis of
a physical sample and identifies the sample from
which the observation was derived. This keys to
a unique LabSampleID (e.g. bottle number) and
name and description of the analytical method
used by a processing lab.
60
Accuracy and Precision
ObsAccuracyStdDev Numeric value that expresses
measurement accuracy as the standard deviation of
each specific observation
61
Observation Series
An Series is a set of all the observations of a
particular variable at one place, i.e. with
unique SiteID. The ObservationSeriesCatalog is
programatically generated to provide a means by
which a user can get simple descriptive
information about the variables observed at a
location.
62
Data Quality
Qualifier Code and Description provides
qualifying information about the observations,
e.g. Estimated, Provisional, Derived, Holding
time for analysis exceeded QualityControlLevel
records the level of quality control that the
data has been subjected to.- Level 0. Raw Data
- Level 1. Quality Controlled Data - Level 2.
Derived Products - Level 3. Interpreted Products
- Level 4. Knowledge Products
63
15 min Precipitation from NCDC
64
Irregularly sampled groundwater level
65
How Excel connects to ODM
Excel
CUAHSI Web service
HydroObjects
- Obtains inputs for CUAHSI web methods from
relevant cells. - Available Web methods are GetSiteInfo,
GetVariableInfo GetValues methods.
parses user inputs into a standardized CUAHSI
web method request.
converts standardized request to SQLquery.
SQL query
Observations Data Model
Response
converts response to a standardized XML.
imports VB object into Excel and graphs it
converts XML to VB object
66
Example Matlab use of CUAHSI Web Services
create NWIS class and an instance of the
class. createClassFromWsdl('http//river.sdsc.edu/
NWISTS/nwis.asmx?WSDL') svsNWIS NWIS
xmlSitesGetSites(svsNWIS) Could parse to
identify sites to work with. SiteID'10109000'
Here specify a SiteID to use
Call the GetSiteInfo function xmlSiteInfoGetSiteI
nfo(svsNWIS,SiteID) Parse the XML that is
returned to learn the variables recorded
there structSiteInfoparse_xml(xmlSiteInfo)
(non trivial) Call the GetVariableInfo
function to get details about each variable
xmlVarInfoGetVariableInfo(svsNWIS,varcodes(i))
structVarInfoparse_xml(xmlVarInfo)
Parse to write results to html file for display
(non trivial)
67
NWIS Site Information Generated using Web
Services in Matlab
68
Retrieve Data using GetValues
xmlValsGetValues(svsNWIS,SiteID,varcodes(1),D1,D
2) Parse the xml string that is returned into
matrices and plot strValuesparse_xml(xmlVals)
(non trivial) plot(dn,Q)datetick
69
Conclusions
- HIS a geographically distributed system of
web-connected data and functions - Hydrologic Data Access System is a significant
technological innovation - Emerging understanding of digital watershed
structure and functions - Beginnings of hydrologic information science and
shared data models with neighboring sciences - Web services provide access to HIS capability
from within a users preferred analysis environment
Recommended
CrystalGraphics Presentations


