
Estimating Population Abundance - PowerPoint PPT Presentation
1 / 35
Title:
Estimating Population Abundance
Description:
Changes in gear effectiveness ... Where would you go to catch fish first? ... probability of being captured by gear, if present, is 100% ... – PowerPoint PPT presentation
Number of Views:357
Avg rating:3.0/5.0
Title: Estimating Population Abundance
1
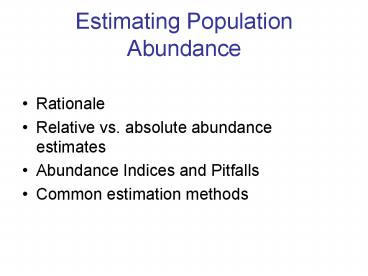
Estimating Population Abundance
- Rationale
- Relative vs. absolute abundance estimates
- Abundance Indices and Pitfalls
- Common estimation methods
2
Absolute vs. Relative Abundance
- Absolute Abundance An estimate of the total
number of individuals present - Relative Abundance A measure that provides an
index of the number of individuals present, but
not the actual numbers
3
Copepod Dynamics in Lake Washington Long term
trends in relative abundance
high abundance
High, less predictable abundance
low abundance
Edmonson and Schindler
4
Why do we need to estimate abundance?
Absolute Numbers Setting harvest
rates Quantifying nutrient / energy
flux Estimating reproductive success
Counting fish is just like counting treesexcept
that they are invisible and they move
5
Estimating Population Abundance
- Rationale
- Relative vs. absolute abundance estimates
- Abundance Indices and Pitfalls
- Common estimation methods
6
Abundance Indices Give a measure of relative
population size We commonly get these
from Fisheries (fisheries-dependent
data) Surveys (fisheries-independent data)
Typical Index Catch per unit effort (CPUE)
7
Basic Rationale
- We presume that our index is proportional to
abundance - I q N
- Where I index, N is population size, and q is
the catchability, which relates the two. - What might q depend upon?
8
Fundamental Assumptions in CPUE-based Abundance
Indices
slope catchability (q)
Abundance Index (CPUE)
Actual Abundance
9
Fundamental Assumptions
- Relationship is linear
- Relationship is stationary (q is constant)
10
Common Problems with CPUE-based Abundance
Indices Non linearity
Hyper-Depletion
Hyper-Stability
Abundance Index (CPUE)
Actual Abundance
11
What causes this?
Changes in catch composition or fishing fleet
behavior Changes in species distribution Changes
in gear effectiveness
Remember catch rates of fisheries, at best,
reflect local abundance (the abundance of fish at
one particular time and place)
12
Spatial Processes and Hyperstability
Fish range when abundant
Fish range when depleted
Abundance
13
Hyper-stability and Newfoundland Cod Crash
True population trend
True population trend
14
Common Problems with CPUE-based Abundance Indices
Hyper-Depletion
Hyper-Stability
Abundance Index (CPUE)
Actual Abundance
15
Myers and Worm, 2003. Rapid worldwide depletion
of predatory fish communities.
Example of Hyper-Depletion
but stock assessments of the most abundant
species (tunas) show less drastic declines.
16
One reason for hyper-depletion Fishery-Based
CPUE samples are not random
- Fishing fleets typically operate in areas where
theyll make the most money - The areas of high fish production change over
time due to localized depletion - Therefore, the areas sampled by the fishery
changes over time
17
Hyper-depletion Example
Productivity
Where would you go to catch fish first?
18
Abundance Indices Give a measure of relative
population size We commonly get these
from Fisheries (fisheries-dependent
data) Surveys (fisheries-independent data)
Even well-designed surveys can give misleading
CPUE trends
19
Bluefish The Terminator IV
it is perhaps the most ferocious and
bloodthirsty fish in the sea, leaving in its wake
a trail of dead and mangled mackerel, menhaden,
herring, alewives, and other species on which it
preys. Bigelow and Schroeder, 1954
not content with what they eat, which is itself
of enormous quantity, rush ravenously through the
closely crowded schools, cutting and tearing the
living fish as they go, and leaving in their wake
the mangled fragments. Goode, 1884
20
Data bottom trawl survey conducted each autumn
A multi-species survey Follow a stratified
random survey design Juvenile bluefish are only
captured on the edges of the surveys
Northeast Fisheries Science Center
21
To calculate CPUE you need to know effort How
do you count the effort of tows conducted in
areas the do not normally have bluefish? Need
to estimate effective effort that accounts for
the habitat preferences of bluefish This is
sometimes called standardized CPUE
22
Step 1 Correlate Catch Rate with tow
characteristics Depth, Temperature, Time of
Day, Date
23
Step 2 Calculate Effective Effort Effective
effort is higher when sampling in areas likely to
catch bluefish
Tows in Deep water, cold water, during the
night, after September Count less
Tows in shallow water, warm water, during the
day, In late September Count more
24
Total Effort ( tows) and Effective Effort
(standardized)
increasing effective effort
25
Unstandardized bluefish CPUE is overly optimistic!
This trend presumes constant effort Effective
Effort was actually increasing
True decline in this period was probably greater
Un-standardized CPUE (kg / tow)
26
Bottom Line Always be very careful in
evaluating abundance indices! Sample design is
critical (random, stratified random) Whenever
possible, look for environmental covariates of
catch rate to standardize effort.
27
Estimating Population Abundance
- Rationale
- Relative vs. absolute abundance estimates
- Abundance Indices and Pitfalls
- Common estimation methods
28
How To Estimate Absolute Abundance
Extrapolating local samples (Area
Swept) Depletion Estimates Mark Recapture
methods Stock - Assessments
29
Extrapolating local samples (Area Swept)
- Need to sample organisms (Must use a method that
samples a known area or volume) - Need some way to extrapolate this sample to the
entire population (the tricky part)
Spatial extent of population
area sampled
30
Area Swept Methods Typically assume 100
catchability probability of being captured by
gear, if present, is 100 Bias results from
variation in catchability large organisms vs.
small organisms good swimmers vs. poor
swimmers Bias is always in the same direction,
but varies among individuals and species
31
Sampling Designs for Population Estimation
- Spatial variation in local abundance causes
imprecision in estimates - How can we improve our sampling designs if there
are known sources of variation?
32
Pipers Creek
- Suppose we wanted to estimate the abundance of
Diptera larva in Pipers Creek - We suspect that local abundance is different in
pools versus riffles
33
Random Sampling Design
Pool
Pool
Pool
Pool
Sampling Point (1 sq ft Surber Sampler)
Population Size Mean Density ( / sq ft) x
Stream Area (sq ft)
Mean Density (SD) 4.425 (3.72) Total Area
10,000 sq. ft Population Size 4.425 / sq ft
x 10,000 sq. ft 44,250 Diptera
34
Stratified Random Sampling Design
Pool
Pool
Pool
Pool
Sampling Point (1 sq ft Surber Sampler)
Stratify samples by stream reach (each gets two
samples) Calculate separate density estimates
for pools and riffles Calculate separate
population estimates for pools and riffles Sum
these to get total population size
35
Stratified Random Sampling Design
Pool
Pool
Pool
Pool
Sampling Point (1 sq ft Surber Sampler)
Riffle Density (SD) 7.45 (2.6) Riffle Area
7,000 sq ft Pool Density (SD) 1.4 (1.1) Pool
Area 3,000 sq ft.
Total population size 7.45 7,000 1.4
3,000 52,150 4,200 56,350 Diptera