
AN EVALUATION OF THE - PowerPoint PPT Presentation
1 / 23
Title:
AN EVALUATION OF THE
Description:
b= 1. c= 36,837. d= 5. n= 36,998. CMAQ = 34.5 0.63(AIRNOW) Max. 1-hour O3. 7 July 30 September ... CMAQ = 35.1 0.62(AIRNOW) a b. c d. a= 3276. b= 149 ... – PowerPoint PPT presentation
Number of Views:31
Avg rating:3.0/5.0
Title: AN EVALUATION OF THE
1
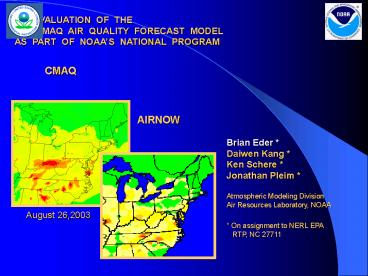
AN EVALUATION OF THE ETA-CMAQ AIR QUALITY
FORECAST MODEL AS PART OF NOAAS NATIONAL
PROGRAM CMAQ
AIRNOW Brian
Eder Daiwen Kang
Ken Schere Jonathan Pleim
Atmospheric Modeling
Division Air Resources Laboratory,
NOAA August 26,2003
On assignment to NERL
EPA RTP, NC 27711
2
Domain
Models-3 CMAQ
Forecast Configuration - Eta
Meteorology - CBIV Mechanism - SMOKE
Emissions (Offline) - 12 km grid resolution
- 22 Vertical Layers - 48 Hr. Forecast
(12Z Init.) Simulation Periods - 7
July 30 September, 2003
- 12 19 August (Rerun with changes)
3
- This evaluation used
- Hourly O3 concentrations (ppb)
- from EPAs AIRNOW network
- 521 stations
- 7 July - 30 September
- A suite of statistical metrics for both
- discrete forecasts and categorical
forecasts - for the
- hourly, maximum 1-hour, maximum 8-hour O3
simulations
4
- Two Forecast / Evaluation Types
- Discrete Forecasts
- Observed versus Forecast
- - Category Forecasts (Two Category)
- Observed Exceedances, Non-Exceedances
- versus
- Forecast Exceedances, Non-Exceedances
5
Discrete Forecast / Evaluation
Statistics - Summary -
Regression -
Biases - Errors
Observed versus Forecast
AIRNOW
6
- Category Forecast / Evaluation
- - Two Category Forecasts
- Observed Exceedances, Non-Exceedances
- versus
- Forecast Exceedances, Non-Exceedances
Forecast Exceedance No Yes
a b c d
No Yes Observed Exceedance
7
Category Forecast
- Accuracy
- Percent of forecasts that correctly predict
event or non-event. - Bias
- Indicates if forecasts are under-predicted
(false negatives) or over-predicted (false
positives) - False Alarm Rate
- Percent of times a forecast of high ozone did
not occur
a b c d
8
Category Forecast
- Critical Success Index
- How well the high ozone events were predicted.
- Probability Of Detection
- Ability to predict high ozone events
a b c d
9
Max. 1-hour O3
CMAQ 34.5 0.63(AIRNOW)
a
a b c d
c
7 July 30 September
a 155 b 1 c 36,837 d
5 n 36,998
10
Max. 1- hour O3
11
Spatial Evaluation
Max. 1- hour O3 Correlation
0.00 0.25 0.25 0.50 0.50 0.75 0.75 1.00
Overall Mean Correlation 0.62
12
Spatial Evaluation
Max. 1 - hour O3 Mean Bias
RMSE
0 10 10 - 20 20 - 30 30 40
-10 10 10 - 20 20 - 30 30 40
Overall Mean RMSE 21.1 ppb
Overall Mean Bias 15.0 ppb
13
Temporal Evaluation
Max. 1 hour O3
Land-use Correction
14
Max. 8-hour O3
CMAQ 35.1 0.62(AIRNOW)
a b c d
a 3276 b 149 c 20,979 d
65 n 24,469
15
Max. 8- hour O3
16
Spatial Evaluation
Max. 8- hour O3 Correlation
0.00 0.25 0.25 0.50 0.50 0.75 0.75 1.00
Overall Mean Correlation 0.59
17
Spatial Evaluation
Max. 8 - hour O3 Mean Bias
RMSE
0 10 10 - 20 20 - 30 30 40
-10 10 10 - 20 20 - 30 30 40
Overall Mean Bias 17.4 ppb
Overall Mean RMSE 22.2 ppb
18
Temporal Evaluation Max. 8 hour O3
Land-use Correction
19
- Land-Use Error
- Land-use fields associated with Eta were being
post-processed incorrectly. As a result - - Most of the domain was classified as water.
- - Dry deposition was greatly under simulated
- This error was discovered/corrected on
Sept. 9th. - - An eight day period (12-19 August) was
re-simulated.
20
- CMAQ Updates
- The latest version of CMAQ was released in the
Fall of 2003 - featured numerous changes
- - updated science
- - efficiency enhancements
- - bug fixes
- - new boundary conditions
- - new Kz values
- - An eight day period (12-19 August) was
re-simulated - - Positive biases were almost eliminated
- - Errors were also reduced
21
Comparison Between Initial, Corrected and Updated
Simulations August 12 19 2003
Max. 1 - hour O3
Max. 8 - hour O3
22
Summary
- The Eta-CMAQ modeling system performed reasonably
well, in this, its first attempt at forecasting
ozone concentrations. - An error was discovered in Etas post
processed land-use designation that resulted in
the - under-estimation of dry deposition
- over-simulation of concentrations
- Once corrected, the positive biases and errors
were greatly reduced when the model was re-run
for an eight day period. - A newer version of CMAQ, released in the fall of
2003, included changes that further reduced the
positive bias and errors when the model was
re-run for an eight day period.
23
Contact information
Brian EderMail Drop E 243-01U.S. Environmental
Protection AgencyResearch Triangle Park, NC
27711eder_at_hpcc.epa.gov919.541.3994
voice919.541.1379 fax
Recommended
CrystalGraphics Presentations


