
Fort Bragg Cantonment Area - PowerPoint PPT Presentation
Title:
Fort Bragg Cantonment Area
Description:
GIS data, supplemented with aerial photography and LIDAR data, are used to model ... A DEM (Digital Elevation Model), a filled DEM and tagged elevation contour lines ... – PowerPoint PPT presentation
Number of Views:74
Avg rating:3.0/5.0
Title: Fort Bragg Cantonment Area
1
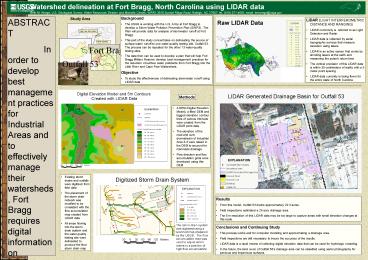
Watershed delineation at Fort Bragg, North
Carolina using LIDAR data Beth M. Wrege, U.S.
Geological Survey, Water Resources Division and
Michelle Cienek, WRRI, 3916 Sunset Ridge Road,
Raleigh, NC 27607 tel. (919) 571-4091 email
bmwrege_at_usgs.gov
- Background
- The USGS is working with the U.S. Army at Fort
Bragg to develop a Storm Water Pollution
Prevention Plan (SWP3). The Plan will provide
data for analysis of stormwater runoff at Fort
Bragg. - This part of the study concentrates on
delineating the source of surface-water runoff to
one water-quality testing site, Outfall 53. The
process can be repeated for the other 13
water-quality testing sites. - The data then can be used to develop a plan that
will help Fort Bragg Military Reserve develop
best management practices for the reduction of
surface water pollutants from Fort Bragg into the
Little River and Cape Fear Watersheds. - Objective
- To study the effectiveness of delineating
stormwater runoff using LIDAR data
Study Area
ABSTRACT In order to develop best management
practices for Industrial Areas and to effectively
manage their watersheds, Fort Bragg requires
digital information on elevations, drainage
basins, stormwater conveyance systems,
streamflow, and existing manmade and natural
features. This information will be used to
develop a stormwater drainage basin runoff model.
The stormwater basin model will serve many
applications, including the evaluation of areas
of high load erosion events, tracking non-point
source pollution, and planning for future
development on base. This pilot study focuses on
the effectiveness of using LIDAR (Light
Interferometric Distance and Ranging) data to
develop an urban stormwater drainage basin model.
LIDAR data are acquired with aircraft-mounted
lasers. Aerial topographic surveys produced from
the LIDAR data provide high-resolution land
surface elevations. GIS data, supplemented with
aerial photography and LIDAR data, are used to
model the areas flowing into industrial outfall
53, a water quality sampling site. The pollutants
sampled in the runoff at outfall 53 can be linked
to the associated Industrial Area, Area 3-3.
The LIDAR data consists of points spaced at
five-meter intervals with a longitudinal,
latitudinal and vertical accuracy within a
measured 35 centimeters in all three dimensions.
These data will allow for the creation of a
digital elevation model (DEM) with a five-meter
cell size that can be utilized to predict the
flow accumulation and flow direction within each
cell. For the pilot study, the elevation of the
road and curb were raised slightly to create a
DEM and a flowdirection model that account for
the influence of manmade structures. Next, a map
linking all known stormdrains and outfalls was
digitized and the stormdrains were adjusted to
fit within the cell of highest flow accumulation.
The area upgradient of the stormdrains is
delineated to create a predictive model of the
overland flow to outfall 53. The estimated area
flowing into outfall 53 by the computer model is
22.3 acres. A USGS hydrologist delineated a
drainage area of 24 acres flowing into outfall 53
during field visits to the site. Close
examination of the final flow map shows a few
areas between the stormdrains that are not
captured in the model. This relates to the
flatness of the area at these points. The model
does not have the sensitivity to account for this
lack of elevation difference. Slight variances
in elevation could not be discriminated using the
LIDAR data. The next step in this pilot study
will be to include the influence of
pervious/impervious land cover. In conclusion,
when working with very small areas with moderate
to little elevation change, LIDAR data with
five-meter spacing can provide a useful tool in
predicting urban runoff and watershed
delineation, but the resolution still may be too
large to predict small variances in the
landscape.
- LIDAR (LIGHT INTERFEROMETRIC DISTANCE AND
RANGING) - LIDAR commonly is referred to as Light Detection
and Radar - LIDAR data is collected by aerial topographic
surveys that measure elevation using lasers - LIDAR is an active sensor that works by shooting
lasers at the earth and measuring the pulses
return time - The vertical precision of this LIDAR data is
within 35 centimeters of reality with a 5 meter
point spacing - LIDAR data currently is being flown for the
entire state of North Carolina
Cape Fear River Basin
Fayetteville
North Carolina
Fort Bragg Cantonment Area
Outfall 53
in meters
Methods
- A DEM (Digital Elevation Model), a filled DEM and
tagged elevation contour lines of various
intervals were created from the LIDAR point data - The elevation of the road and curb downstream of
Industrial Area 3-3 were raised in the DEM to
account for manmade drainage - Flow direction and flow accumulation grids were
developed using this DEM
- Existing storm drains and outfalls were digitized
from field data - The placement of the storm drain network was
modified to be consistent with the flow
accumulation map created from LIDAR data - All areas flowing into the storm drain system and
the water-quality testing site were delineated to
produce the final storm drain map
- Results
- From this model, Outfall 53 drains approximately
22.3 acres. - Field inspections estimated a 24 acre drainage
area. - The 5 m resolution of this LIDAR data may be too
large to capture areas with small elevation
changes at this scale.
- Conclusions and Continuing Study
- This process works well for computer modeling and
approximating a drainage area. - Field inspections are still necessary to insure
the accuracy of the results. - LIDAR data is a rapid means of collecting digital
elevation data that can be used for hydrologic
modeling. - In the future, the land cover of Outfall 53s
drainage area can be classified using aerial
photography for pervious and impervious surfaces.
Recommended
CrystalGraphics Presentations


