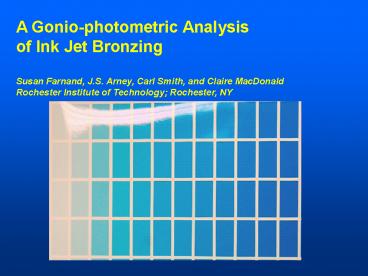
A Goniophotometric Analysis
1 / 28
Title: A Goniophotometric Analysis
1
A Gonio-photometric Analysis of Ink Jet
Bronzing Susan Farnand, J.S. Arney, Carl Smith,
and Claire MacDonald Rochester Institute of
Technology Rochester, NY
2
Part (I) The RIT Micro-Goniophotometer
JIST, 51(6)509(2007)
3
The RIT/HP m-goniophotometer
4
parallel polarizers
crossed polarizers
Specular Only
Specular Diffuse
Diffuse
5
Light Sources (R, G, or B)
Camera
Capture 2 images
Polarizers
Linear Illuminator
Cylinder
6
Schematic of the Instrument
w
Angular Distribution Width in Degrees, W
7
Schematic of the Instrument
A
Area, A, gives the Fresnel reflectance factor, r.
8
Measurements of W and r are at a fixed Specular
(gloss) Angle, q.
q
q
9
Measurements r as a function of q.
q
q
A black ink in s polarization
0.28
r
0.04
0
0
0
90
90
90
0
0
0
q
q
Fresnel's Law modeled with optical constants n
1.5 and k 0.0.
10
A black ink in s and p polarization
Experimental data
Fresnel's law at n1.50, k0
p polarization
s polarization
0.28
0.28
r
r
0.04
0.04
0
0
0
0
0
0
90
90
90
0
0
0
90
90
90
0
0
0
q
q
q
q
11
Example 1
Measured in red light.
12
Example 2
Two black inks that differ in both n and k.
Measured in red light.
13
In all cases observed to date, r gt 0.1 at q 0
occurs only when k gt 0.
14
Example of a bronzing cyan ink.
red light green light blue light
rr 0.22 rg 0.10 rb 0.15
k gt 0
I
0
0
10
20
30
-30
-20
-10
a
Example of a NON-bronzing cyan ink.
rr 0.043 rg 0.048 rb 0.050
k 0
0
0
10
20
30
-30
-20
-10
a
15
Part (II) Bronzing behavior along the tone
curve
A black ink observed to bronze yellowish in the
mid-tones.
16
Dot structure of cyan
1 2 3 4 5 6 7 8 9
10 11 12 13 14 15 16 17
Measurements with a PIAS imaging microscope by
QEA, Inc.
Step 2 Dot Area fraction F0.60 Red
Density D 0.17
17
1 2 3 4 5 6 7 8 9
10 11 12 13 14 15 16 17
Step 17
1
Increasing ink concentration
Density
0.5
Step 8
0
0
0.5
1
Dot Fraction, F
18
(No Transcript)
19
Linearly Additive
rink
rink
rpaper
rpaper
20
0.2
Fresnel Reflectance
r
0.1
Step 8, F1
0
1.5
0.5
1.0
0
Density
Stacking of ink dots
21
Similar behavior with a cyan ink ramp.
0.12
r
0
0
1
Density
Step where F ? 1
Bronzing is manifested by a significant increase
in the red Fresnel reflectance factor, resulting
in magenta bronzing.
22
Part (III) Instrumental Bronzing Index
vs Visual Bronzing Magnitude.
Observations of these and other printed samples
indicates that bronzing occurs primarily because
of an enhanced specular reflectance factor, r, in
the red or the red and green portion of the
spectrum. A bronzing hue angle might be defined
in terms of the RGB values of r.
23
In the current work, only the perceived
magnitude of bronzing was examined by visual
psychometric analysis.
The individual steps from the gray ramp of the
black bronzing sample were cut out. Observers
were asked to sort them from most bronzing to
least. Averaging over several observers
resulted in visual a bronzing scale, V.
24
The visual bronzing values, V, were compared
to an instrumental index for bronzing magnitude,
Br, arbitrarily defined as follows.
Average value of r
Reflectance deviations, d
Average Deviation, Br
25
Cyan Samples
Black Samples
20
20
Visual Bronzing, V
Visual Bronzing, V
0
0
0
0.02
0.04
0.06
0
0.02
0.04
0.06
Instrumental Bronzing, Br
Instrumental Bronzing, Br
26
The product of the specular index, Br, and
the Lambertian density, D, empirically provides a
very successful index of bronzing magnitude.
27
Conclusion Bronzing results from a difference
in the specular reflectance factors between red,
green, and blue. reddish bronzing rred gt rgreen
rblue . The observed magnitudes of r suggest a
significant contribution from both optical
constants, n and k. Visual Bronzing magnitude
can be model by the product BrD, where Br is the
specular component and D is the Lambertian
component of reflectance. Analysis of the
specular reflectance along the tone scale reveals
unexpected behavior of the material optical
constants n and k, that deserves further
investigation.
28
Thanks to colleagues at Lexmark and at
Hewlett-Packard for kindly providing interesting
samples of bronzing for our optical analysis.


