
Common Operating Picture Example of Forecasts for DFW
1 / 15
Title:
Common Operating Picture Example of Forecasts for DFW
Description:
Local convective weather. ... Queuing Delay (No Weather) plus Ripple Effects. No particular weather factor recorded locally for the given airport / given hour ... –
Number of Views:149
Avg rating:3.0/5.0
Title: Common Operating Picture Example of Forecasts for DFW
1
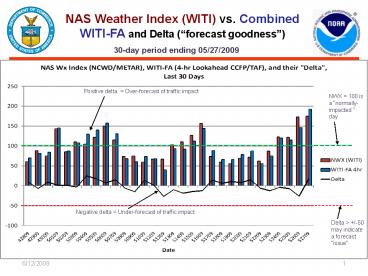
NAS Weather Index (WITI) vs. Combined WITI-FA and
Delta (forecast goodness)
30-day period ending 05/27/2009
Positive delta Over-forecast of traffic impact
NWX 100 is a normally-impacted day
Negative delta Under-forecast of traffic impact
Delta /-50 may indicate a forecast issue
1
6/12/2009
2
En-route and Terminal WITI-FA30-Day Period
Ending 05/27/2009
En route Convection E-WITI (NCWD) vs. E-WITI-FA (
CCFP)
Positive Delta Over-forecast
Negative Delta Under-forecast
Terminal Weather T-WITI (METARs) vs. T-WITI-FA (T
AFs)
Positive Delta Over-forecast
Negative Delta Under-forecast
2
6/12/2009
3
NAS Wx Index Breakdown by Component Last 7
Days, Ending 05/27/2009
High number of Cnx due to Tstms, Low Cigs, Wind
Delays (duration) may have been under-reported
total 2410 delays but normalized ASPM Delay is
only 68
6/12/2009
3
4
TWITI, 7-Day Period Ending 05/27/2009, by
NWS Region TWITI shows potential operational
impact of IMC, Wind, Winter precipitation, and
Local convective Wx
Terminal Weather T-WITI (METARs) vs. T-WITI-FA (T
AFs)
Positive Deltas (bars) over-forecast
Negative Deltas (bars) under-forecast
4
5
Analysis of Selected Airport / Days
5
6/12/2009
6
Analysis for selected airports/days
Central Region, Wednesday, May 27, 2009
Overestimation of Wx impact (over-forecast) at
ORD However, this had relatively little impact
on operations (see next slide)
7
Analysis for selected airports/days
Central Region, ORD, Wednesday, May 27, 2009
Lower ceilings, mist (BR) and rain forecast
actual Wx was cloudy skies, light winds, no rain
8
Analysis for selected airports/days
Central Region, ORD, Wednesday, May 27, 2009
9
Analysis for selected airports/days
NCWD vs. 4-hr CCFP, May 26, 2009
Some under-forecast for late evening on May 26
10
AvMet Applications Website
For more detailed drill-down and analysis,
please go to www.avmet.com/CWITI
10
6/12/2009
11
NWX / WITI / WITI-FA Components
- WITI model consists of two principal components
En-route (E-WITI) and Terminal (T-WITI). The
NAS-wide WITI metric is called NAS Wx Index
(NWX). - En-route WITI (E-WITI) reflects the impact of
en-route convective weather and en-route traffic
demand (flows between OEP34 airports) on the
NAS. - Terminal WITI (T-WITI) reflects the impact of
local airport weather and local traffic demand on
the airports operation - Airport capacity can decrease due to inclement
weather (low ceilings, rain, snow, wind etc).
Arrival and departure rates may be reduced,
resulting in delays and/or cancellations. - If scheduled traffic demand exceeds airport
capacity (be it in good or bad weather), queuing
delays ensue. These delays can quickly grow
exponential in some cases, wide-spread
cancellations are the only way to limit
non-linear growth of delays. - T-WITI reflects both the linear increase in
delays (some impact of inclement weather but
airports capacity remains higher than traffic
demand) and, in more severe cases, non-linear
increase in delays (impact of weather and/or
traffic demand grows exponentially when demand
exceeds airports capacity) - NWX / WITI is computed using actual (recorded)
weather. WITI-FA (Forecast Accuracy) is
computed using forecast weather, both en-route
convective and terminal.
12
NAS Wx Index Breakdown by Cause Explanation
to Slide 3
- NAS Wx Index / WITI software can distinguish the
following factors - En-route convective weather. This shows
convective weather impact on an airports
inbound/outbound flows within approx. 500-NM
range. This component does not affect queuing
delay at the airport. - Local convective weather. This reflects how
convective weather in the vicinity (directly over the airport reduces airports
capacity. It may affect queuing delay. - Wind. Any time there is a wind greater than 20
Kt, or there is precipitation and wind greater
than 15 Kt, the corresponding impact is recorded.
Airport capacity may decrease, i.e. queuing
delays may increase. - Snow, freezing rain, ice etc. The corresponding
impact is recorded. Airport capacity may
decrease, i.e. queuing delays may increase. - IMC. Ceiling or visibility below airport specific
minima fog and heavy rain. The corresponding
FAA capacity benchmarks for IMC are used. Queuing
delays may increase. - Queuing Delay (No Weather) plus Ripple Effects.
No particular weather factor recorded locally for
the given airport / given hour but WITI software
computed that there would be queuing delays. This
can be simply due to high traffic demand or in an
aftermath of a major weather event when queuing
delays linger on (even as the weather has moved
out). - Additionally, Ripple Effects are recorded in this
component. For example, if ORD experiences
departure queuing delays, its corresponding
destination airports will get some additional
arrival queuing delay. - Other. Includes minor impacts due to
light/moderate rain or drizzle but
ceilings/visibility above VFR minima also
unfavorable RWY configuration usually due to
light-to-moderate winds (15-20 Kt or even 10 Kt)
that prevent optimum-capacity runway
configurations from being used.
Convective
Non-convective
Other
13
Rolling 4-hr Look-ahead Forecast
- 4-hr TAF is mentioned throughout this slide
set. - In actuality, Terminal Area Forecasts (TAFs) are
issued every 6 hours, with amendments issued at
irregular time intervals if/as necessary. - From this TAF stream, the WITI software
constructs a rolling 4-hr look-ahead forecast. - If, for instance, it is 1300Z and an operator at
airport NNN would like to know the expected
weather situation at 1700Z, what is the TAF
information available to him/her at 1300Z? It
could be the standard 1200Z TAF valid through
1800Z) with perhaps an amendment issued at 1300Z.
An hour later, at 1400Z, if the operator needs to
know the forecast for 1800Z, he or she might
still have the same information as at 1300Z but
perhaps a new amendment has been issued, and so
on. - Rolling 2-hr, 4-hr and 6-hr CCFP (convective
forecast) is interpreted in a similar fashion.
There are no amendments as in TAF. CCFP is issued
every 2 hours at odd hours (1300Z, 1500Z, ) as a
set of three forecasts. A CCFP forecast for even
hours is an interpolation of these 2-hr CCFPs.
14
Arrival Rate Charts (Analysis)
Scheduled and actual arrival rates (solid purple
and dashed blue lines on the above sample chart)
are extracted directly from ASPM data. METAR and
Rolling-4hr-lookahead-TAF based rates (red and
yellow lines) are WITI model estimates based on
historical data and FAA airport capacity
benchmarks.
- Things to keep in mind
- WITI model estimated rates show potential airport
capacity given the perceived or expected weather
impact. - Direct comparison between WITI model-estimated
and actual arrival rates should be made with
caution the WITI model does not reflect all the
factors, events and human decisions that are
behind a specific actual arrival rate. Comparison
with facility-called rates can help to understand
these effects. - Recorded (actual or forecast) weather data is
discrete for example, wind is recorded in hourly
intervals and its direction can vary, affecting
what WITI model selects as the optimal runway
configuration. Or, snow can start and stop. But
actual impact of weather can be longer-lasting
(e.g. snow removal) and an airport cannot react
to wind changes by changing runway configuration
in an abrupt manner. The result may be a larger
variability in WITI model-forecast rates vs.
actual arrival rates. - Non-weather factors, as well as weather in other
parts of the NAS, may impact airport capacity on
a particular day this is not reflected in WITI
model-based arrival rates (they are based only on
local weather). - Suggested uses for the arrival-rates charts
- Significant differences between METAR- and
TAF-based arrival rates may be an indication of
an over- or under-forecast of terminal weather - In some cases, these significant differences may
be coupled with actual arrival rates being
noticeably lower than scheduled. This, in turn,
may in some instances indicate an impact of an
inaccurate weather forecast.
15
Snow/Ice Impact Quantification
Moderate snow/ice may in some instances cause
higher impact on airports (delays) than indicated
by NWX/WITI. The reason is that even as the
snowfall stops and winter weather moves out, snow
and ice removal may take a long time this is not
reflected in METAR/TAF data and hence the
NWX/WITI may be lower. Also, it takes time for
airlines to restore their schedules back to
normal, which again leads to higher delays
compared to perceived weather impact. Conversely
, on days with very heavy impact of winter
weather, NWX can be much higher than the
normalized Delay. This is due to massive
cancellations that lower traffic demand. However,
in these cases NWX correctly reflects the overall
weather impact on the NAS. Typically, on the
next day, when the winter weather moves out, NAS
Delay metric is significantly higher than NWX (as
airlines work to restore schedules back to
normal).
Recommended
CrystalGraphics Presentations


