Predictive Coastal Erosion Modeling - PowerPoint PPT Presentation
1 / 36
Title:
Predictive Coastal Erosion Modeling
Description:
Use the model and projected H and Ta (for 2045) to estimate future erosion rates ... Extend erosion projections throughout study site (Smith Bay to Harrison Bay) ... – PowerPoint PPT presentation
Number of Views:280
Avg rating:3.0/5.0
Title: Predictive Coastal Erosion Modeling
1
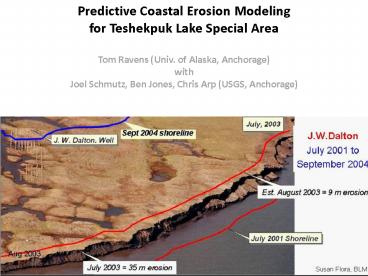
Predictive Coastal Erosion Modeling for
Teshekpuk Lake Special Area Tom Ravens (Univ. of
Alaska, Anchorage) with Joel Schmutz, Ben Jones,
Chris Arp (USGS, Anchorage)
2
Smith
Harrison Bay
3
(No Transcript)
4
International Migratory Bird and Subsistence
Value
WHY?
5
(No Transcript)
6
(No Transcript)
7
(No Transcript)
8
Thermo-erosional niche at Dalton Wellhead
9
(No Transcript)
10
Conceptual Model of Coastal Erosion
1. Thermo-erosional niche
2. Niche growth
active layer
active layer
bluff
bluff
Thermo-erosional niche
Niche growth
3. Block collapse/ slump
active layer
active layer
bluff
bluff
11
Mathematical models of thermo-erosional niche
growth(Kobayashi 1985)
heat used to melt ice
warm water
cooler water
q
Rate of niche growth/erosion (m/yr) dxm/dt C
H3/4(Ta-Tm)
where C is a constant (including latent heat of
fusion), H is wave height,
Ta is ambient water temperature, and
Tm is the melting temperature.
12
Model of rate of retreat of frozen bluff
(Kobayashi et al. 1999)
lc
Rate of retreat (m/year) lc hc (Ta-Tm)
/Lc(Hc-Bc) where hc convective heat transfer
coef. C2 H Or, . rate of retreat C3 H
(Ta-Tm)
13
Conventional coastal engineering
approach(Without accounting for permafrost
melting)
- Cross-shore (offshore) sediment transport will
result if the beach profile is not in equilibrium
with the wave climate and the sediment grain size - Transport will be related to the wave energy
flux, F - F E Cg 1/8 ? g H2 (gh)1/2 H2.5
14
Our approach
- Assume an erosion rate (ER) expression
- ER C Hn (Ta-Tm)
- Use measured erosion rates (from 1955-1979 and
2002-2007), and data on H and Ta (from those two
periods) to calibrate model (i.e., determine
best fit C and n) - Use the model and projected H and Ta (for 2045)
to estimate future erosion rates
15
SWAN wave modeling
- Model accounts for wind generation, refraction,
breaking, and energy exchange between frequencies - Model was operated in quasi-steady mode, using
wind data from Barrow - Extent of open water in four open water months
was determined from sea ice data
16
Example Beaufort Sea Ice Data
Study site
17
Bathymetry for wave model
depth m
Effective ice edge October 2002-2007
Effective ice edge October 1955-1979
latitude
study site
Barrow
longitude
18
SWAN-calculated wave height(12 m/s NE wind, Oct
2002-2007)
wave height m
study site
19
Regional temperature increase in West Beaufort
Sea 1970-2007
4
2
temp C
0
-2
1960
1980
2000
From Steele et al. 2008
20
Nearshore/offshore long-term temperature
differential
From Steele et al. 2008
21
Monthly average Prudhoe Bay temperature
(1991-1994)
22
Assumed temperatures used in erosion rate model
23
Increasing wind speed in 2002-2007
24
Study site North of Lake Teshekpuk (70 53
N, 153 52 W) Erosion rate 5.3 0.5
m/yr (1955-1979) 7.4 0.6 m/yr
(1979-2002) 13.0 1.0 m/yr
(2002-2007)
25
Model Calibration and Results
- Erosion rate 11.3 H 2.6 (Ta-Tm) m/yr
26
Projection of cumulative erosion
27
Variation of erosion rate with month
28
Conclusions
- The erosion rate is likely to increase
significantly in the coming years - The erosion rate on the Beaufort Sea coast by
Drew Point may increase to about 50 m/yr by 2045 - The erosion rate went as H2.6 but the dependence
on H might be reduced if water level was
explicitly accounted for by the model
29
Future work
- Extend erosion projections throughout study site
(Smith Bay to Harrison Bay). - Develop a more mechanistic or physics-based
accounting of the erosion process. - Account for niche growth, erosion of fallen
block, dispersal of sediments - Include additional environmental variables (e.g.,
bluff height, soil ice content, soil grain size,
beach elevation/slope, sea level rise) - Storm-surge modeling
30
Future work (continued)
- Develop a better understanding of wave generation
and propagation in ice floes. - More precise accounting of historic temperature
using original data - More precise projection of future ice and
temperature conditions (if possible)
31
Evolution of a North Slope barrier island
(Narwhal Island, North Arctic Alaska)
1955-2007 Thomas M. Ravens and William
Lee University of Alaska, Anchorage
32
(No Transcript)
33
Westward movement 5 m/yr, 1955-1990 24
m/yr, 1990-2007
1955
1990
2007
34
Questions?
35
(No Transcript)
36
(No Transcript)


