
A presentation by - PowerPoint PPT Presentation
1 / 31
Title:
A presentation by
Description:
Remote Sensing and Monitoring Ice Conditions in the Great Lakes ... Special chart, derived from NAIS ice analysis, designed specifically for Coast Guard operations ... – PowerPoint PPT presentation
Number of Views:134
Avg rating:3.0/5.0
Title: A presentation by
1
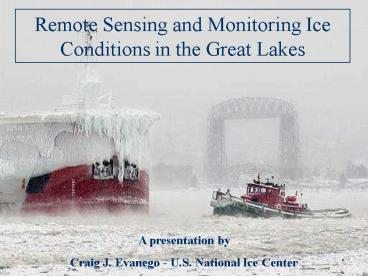
Remote Sensing and Monitoring Ice Conditions in
the Great Lakes
A presentation by Craig J. Evanego - U.S.
National Ice Center
2
Overview The Use of Remotely Sensed Data for
Great Lakes Ice Analysis
- I. Purpose Importance of monitoring ice
conditions in the Great Lakes - II. Present Existing data sources
- III. Future Capabilities/advantages of a new
data source
3
North American Ice Service (NAIS)
4
NAIS Mission
- Combine strengths of each Ice Center
- Offer an integrated ice information service for
North America - High quality and consistency
- Single point-of-access for users
- Optimize resources of both countries reduce
duplication of effort - Data access, system development, research, etc
- Built around a common public suite of products
- Each center maintains ability to provide service
for individual clients independently
5
NAIS Ice Analysis of the Great Lakes
6
Typical Ice Conditions in the Great Lakes
7
Importance of Monitoring Ice Conditions in the
Great Lakes
- Aid the Safety of Winter Navigation and Coast
Guard Operations
2) Monitoring Climate Variability and Change
8
Monitoring Great Lakes Ice Conditions to Aid
Safety of Navigation
9
Monitoring Great Lakes Ice Conditions to Aid
Safety of Navigation
- Special chart, derived from NAIS ice analysis,
designed specifically for Coast Guard operations - Shows thickest forms of ice present across the
Great Lakes
10
Monitoring Great Lakes Ice Cover to Monitor
Climate Variability Change
from Assel (2003)
from Assel et al (2003)
- Great Lakes ice cover is a sensitive indicator of
regional climate and climate change (Assel and
Rodionov, 1998)
11
NAIS Ice Analysis of the Great Lakes
Primary Remote Sensing Data Sources
- Synthetic Aperture Radar (SAR)
- - RADARSAT
- - ENVISAT
2. Moderate Resolution Imaging Spectroradiometer
(MODIS)
3. DMSP Operational Linescan System (OLS)
4. Advanced Very High Resolution Radiometer
(AVHRR)
5. Geostationary Operational Environmental
Satellites (GOES)
12
Great Lakes SAR imagery
- Primary data source for the NAIS Great Lakes ice
analysis - Currently using data from Radarsat-1 and Envisat
- Advantages
- SAR imagery is all-weather
- Excellent spatial resolution (ScanSAR Wide Mode
100 m) - Using ScanSAR Wide mode, can get complete
coverage of Lakes 2-3 times per week.
13
Great Lakes SAR imagery - Annotated
14
Explanation of the WMO Egg Code
15
Explanation of Coding for Lake Ice
Ice Type Code Thickness New Ice 1
0-10 cm Thin Lake Ice 4 10-15 cm Medium
Lake Ice 5 15-30 cm Thick Lake Ice 7
30-70 cm Very Thick Lake Ice 1 gt70 cm
16
Great Lakes SAR imagery - Annotated
17
Great Lakes SAR imagery - Annotated
18
Great Lakes MODIS imagery
- Along with SAR, an important data source for the
NAIS Great Lakes ice analysis.
- Advantages
- Good spatial resolution (up to 250 m)
- Available in true color
- Data available over entire Lakes region each day
- Available, in GeoTiff format, from sites on WWW
19
Great Lakes MODIS imagery
March 12, 2006
20
Great Lakes MODIS imagery NOAA Coastwatch
21
Great Lakes MODIS imagery
- True color
- Visible imagery
- High spatial resolution at 250 m.
- GeoTiff format ideal for use in NIC analysis.
22
Great Lakes MODIS imagery
Visible MODIS image from December 2, 2005 (Note
new ice forming along western shore of southern
Green Bay.)
23
Great Lakes MODIS imagery - Annotated
24
Great Lakes DMSP OLS imagery
- Another commonly used data source, used in
conjunction with SAR and MODIS data, for the NAIS
Great Lakes ice analysis.
- Advantages
- Good spatial resolution (up to 550 m)
- Data available over entire Lakes region each day
25
Great Lakes DMSP OLS imagery - Annotated
26
NAIS Analysis Software
- Based on ESRIs ArcGIS software
- Allows for editing of lines and egg code
attributes, as well as chart generation
27
Ice Analysis in the Future
- RADARSAT-2
- Expected launch in December of 2006.
- RADARSAT-2 will have the capability to send and
receive both H and V in four states HH, HV, VH,
and VV - 1st commercial spaceborne SAR to offer
quadrature-polarimetry ("quad-pol") capability - Polarimetric data could be used to locate
regions of severe ice deformation, which is a
primary concern for winter navigation in the
Great Lakes
28
Multiple Polarization RADARSAT-2 vs. its
Predecessors
- Polarimetric data available on RADARSAT-2 will
enable analysts to better interpret regions of
ice deformation.
29
Use of Polarimetric Data to Identify Region of
Severe Ice Deformation
30
Multiple Polarization Cross-Polarization
HH- polarized
HV- polarized
(from Van der Sanden and Ross, 2001)
31
Questions / Comments?
Recommended
CrystalGraphics Presentations


