A brief overview of well logs
1 / 24
Title: A brief overview of well logs
1
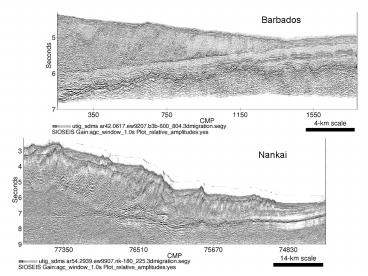
Barbados
Nankai
2
(No Transcript)
3
A brief overview of well logs
From http//www.sjgs.com
4
Uses of well logs
- Define physical rock characteristics
- lithology
- porosity and permeability
- structure
- fracture orientation
- Identify fluids
- Fresh water or brine
- Oil or gas
- Amount of saturation
- Information about the well itself
- Width of hole
- Inspect hole, fractures, etc.
- Calibration of seismic data
- velocities
- exact identification of reflections
- Choice depends on budget and purpose.
- 100 million test well - every log known to
mankind. - well in area of known geology might only have
electric and gamma ray
5
Types of well logs
- Electric
- Spontaneous potential
- Induction
- Nuclear
- Gamma ray
- Density
- Neutron porosity
- Acoustic (sonic)
- Other
- Dipmeter
- Photoelectric
- Caliper
- Imaging
- NMR
- Plus new ones
6
- Gory details
- Instrument lowered on a wire (wireline or
borehole logs). - Data transmitted to top.
- Hole is usually uncased, i.e. an open hole held
open by pressure of drilling mud (or oil or foam
or air). - Drilling fluid seeps into surrounding formation.
- Width of drill hole may vary shale may cave in
for example - Want to measure properties of uninvaded zone
further from the well.
7
- Electric logs
- Spontaneous potential (SP)
- Measures voltage difference between electrode in
well and at surface - Shale positive sand negative
- Identifies permeable zones (usually sandstone)
and boundaries. - Resistivity
- Uses induction and measures resistivity
- Distinguishes type of fluid hydrocarbon, fresh
water and brine. - Many types and names differ largely in depth of
penetration. - Short penetration reflects drilling mud longer
is due to formation water. - Usually used in combination and can be used to
make quantitative estimates of porosity,
permeability, etc.
Sandstone
Rocks, fresh water, and hydrocarbons are
resistive current can only flow through rocks
containing salt water.
8
- Nuclear logs
- Density and porosity logs
- Neutron density
- Amount of hydrogen ion
- Type of fluid
- Density
- can estimate porosity
- Gamma ray
- Measures natural radioactivity
- Sandstone and carbonate usually low
- Shale high
- Sandstones (or carbonates) with feldspar,
glauconite, or mica also high due to potassium. - Some gamma ray logs may distinguish between
potassium, thorium, or uranium. - Can be run in cased hole.
9
Sonic logs, check-shot surveys, and VSPs
Sonic log lower a sonde down a well. Measure
P (and maybe S) wave speed between a source and a
geophone mounted on the sonde. Check shot survey
suspend a geophone and source near well on
surface. VSP suspend geophones at regular
intervals down the well with multiple sources
Blocked
Sonic log
10
Synthetic seismograms
- Purpose to identify exactly (i.e. what
formation) is creating a given reflection. - Obtain a velocity and density profile with depth
(usually from a sonic log) - Convert to acoustic impedances and reflection
coefficients - Convolve with a wavelet, either theoretical or
derived from the data. - Sometimes works, sometimes doesnt
- Problems
- - sonic logs have
- errors due to
- hole variations, etc
- - wavelet may be
- incorrect
- - lateral variations
- may cause changes
11
0.25
-0.25
Reflectivity series
wavelet
0,0,0,0.15,0,0,0,0.3,0,0,0,0.1,0,0,0,-0.1
0,1,0,-2,0,1,0 ..
Spacing between Rc corresponds to two-way P wave
travel time through layer at same sample rate as
wavelet
12
(No Transcript)
13
Example directly compared with seismic data
(gamma ray and sonic logs)
14
Synthetic seismograms in Kingdom Suite
- Use well log data to tie seismic data
- Simulated seismic response
- Need
- Velocity curve (can generate)
- Wavelet (can generate)
- Acoustic log (can make from other logs also)
- Under projectsynpak
15
This is what we get
Can change phase
16
Log display on Kingdom
Click to set which logs to display
Display synthetic on section Not bad
17
Finding area with planimeter
Under tools, polygon
18
Now read the area
Now we have the area Use contour intervals to
estimate thickness (0.02 seconds)
19
How much?
0.009 km2 25 m thick So 225,000 m3 25
porosity 56250 m3 6.9 barrels per m3 about 8000
barrels 320,000
20
inversion
- Under tracepak, inversion, high freq
- Inverts for acoustic impedance
21
Correlation polygon
grab a chunk of line and move to verify
correspondence across a fault or discontinuity
22
Flatten/unflatten
What good is this?
23
Isopach (under tools/depth conversion)
Thickness of a layer
24
Interpretation done?
- Convert to a geologic model
- Convert from time to depth
- May want to restore


