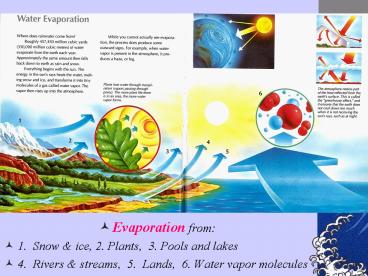
Evaporation from:
1 / 20
Title:
Evaporation from:
Description:
... from high pressure to low pressure areas, picking up moisture (water vapor) from ... Warm moist air rises over, say, a mountain, condenses & form precipitation. ... –
Number of Views:49
Avg rating:3.0/5.0
Title: Evaporation from:
1
- Evaporation from
- 1. Snow ice, 2. Plants, 3. Pools and lakes
- 4. Rivers streams, 5. Lands, 6. Water vapor
molecules
2
- 1. Warm area heats the air above, 2. Bubble of
warm air rises slowly - 3. As it rises, the air expands and cools,
- 4. When air has cooled, water droplets form
around the condensation nuclei - 5. Clouds form High (. 6000m), medium
(2000-6000m), and low ( 2000m) level clouds
3
Cirrus CloudsHigh-level
- The most common form of high-level clouds that
are thin and often wispy. Typically found at
heights gt 6,000 m, in fair weather and point in
the direction of air movement at their elevation,
cirrus clouds compose of ice crystals originated
from the freezing of supercooled water droplets.
Cirrus Cloud, Australia
4
Altocumulus Cloud (Mid-Level)
- Altocumulus may appear as parallel bands (top) or
rounded masses (bottom). Typically a portion of
an altocumulus cloud is shaded. - It usually form by convection in an unstable
layer aloft, which may result from the gradual
lifting of air in advance of a cold front. The
presence of altocumulus clouds on a warm and
humid summer morning is commonly followed by
thunderstorms later in the day.
- Cumulonimbus
5
Nimbostratus Cloud (low level)
- Dark, low-level clouds accompanied by light to
moderately falling precipitation. Low clouds are
primarily composed of water droplets since their
bases generally lie below 2,000m. If temperature
is cold enough, these clouds may also contain ice
particles and snow.
When cloud particles become too heavy to remain
suspended in the air, they fall to the earth as
hail, rain, freezing rain, or snow.
6
- 1. Winds flow from high pressure to low pressure
areas, picking up moisture (water vapor) from the
ocean, bringing rain and storms along the way.
7
- When water droplets grow to 0.1 mm or larger,
they begin to fall as rain because air currents
can no longer keep them in suspension. Darker
clouds tend to give rise to heavy rainfall. Ice
crystals fall as snow or hails can melt as they
warm up.
8
- At low temperature, water droplets freeze to ice
crystals that can come in infinite numbers of
form give rise to snowflakes, which accumulates
on mountain tops. Snow can melt as weather
warms, or turn into ice and flow down the valleys
as glaciers.
9
- 1. Warm air rises over cold air, 2. Cirrus
clouds form - 3. Cirrostratus signal that it will soon rain,
4. It normally rain in here first, 5.
altostratus clouds bring rain, 6. Cold air
passes below warm air.
10
- 1. 2. Warm air rises as 3. cold air descends
below forcing the warm air upwards, - 4. Cumulonimbus clouds bring heavy rains, 5.
Anvil-shaped clouds on top.
11
- 1. As warm front passes over, nimbostratus
disappears is replaced by stratus and
stratocumulus clouds. - 2. Clear patches begin to appear in the sky
- 3. rain stops intermittently
- 4. Poor visibility, 5. High humidity in air
12
Orographic Storms
- Warm moist air rises over, say, a mountain,
condenses form precipitation. Windward slope
has more rain. Leeward slope has less rain.
13
- 1. Heavy storms bring bad weather to sea,
- 2. Low visibility because of heavy rains
- High waves created by winds
14
Radar Image of Pacific Canada
- Radar echoes are processed to provide real time
information on rainfall distribution and
intensity.
15
MOTIVATION
Acquire detailed spatial rainfall fields over
large aerial coverage frequently. e.g. Weather
Surveillance Radar-1988 Doppler (WSR-88D)
Hourly
16
IR/MW TB rainfall measurement
- IR measures CLOUD TOP Brightness Temperature (TB)
- The colder the IR TB ? high rain rate
- MW TB penetrates clouds The colder the MW TB (at
85.5 GHz) gt high rain rate
17
Total rainfall accumulation field (mm) in 168
hours for Medium Stratiform event
GAUGE mean51 std4mm
RADAR mean34 std10mm
STRATIFORM-MEDIUM EVENT (8-14 December, 1994)
plotted from 0.5mm contour interval
18
Total rainfall accumulation field (mm) in 168
hours for Medium Stratiform event
Mean51 std4mm
Mean34 std10mm
RADAR
GAUGE
Mean52 std6mm
Mean44 std10mm
WAVELET
SOA
19
Satellite data availability
Tropical Rainfall Measuring Mission (TRMM)
satellite Coverage (350N 350S) 12 or 24-hr
resolution Microwave TB 5 km res. (channels 8
9 at 85.5GHz) IR TB 2.4 km res. (channel at
10.8um)
20
Satellite data availabilityGOES IR TB Hourly,
4km res. (ch4 at 10.7um)


