National Park Service - PowerPoint PPT Presentation
1 / 26
Title:
National Park Service
Description:
Modeling Species-Habitat Relationships Using Inventory Data ... Habitat selection in a pinyon-juniper woodland rodent ... P-J woodland habitat. ... – PowerPoint PPT presentation
Number of Views:82
Avg rating:3.0/5.0
Title: National Park Service
1
National Park Service Upper Columbia Basin Network
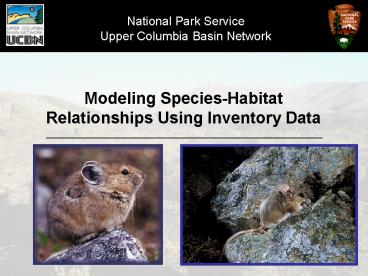
Modeling Species-Habitat Relationships Using
Inventory Data
2
National Park Service Upper Columbia Basin Network
Modeling Species-Habitat Relationships Using
Inventory Data
- Introduction why bother?
- Occupancy estimation a model-based approach
- Example 1 Pika at CRMO
- Example 2 Pinyon-juniper woodland rodent
community at CIRO
3
National Park Service Upper Columbia Basin Network
The Distribution and Abundance of Organisms A
Fundamental Concern
Where do species occur? Why? How many?
4
National Park Service Upper Columbia Basin Network
Resource Availability and Selection
- Species Presence/Absence Occupancy
Occupancy The proportion of area, patches, or
sample units occupied or used by a species
Used vs. unused patches Used vs. available habitat
Mackenzie et al. 2006
5
National Park Service Upper Columbia Basin Network
Resource Availability and Selection
- Issues of scale at what scale is selection
occurring and important?
- Multiple patterns can arise from a single
process or mechanism - multiple processes can
lead to the same pattern
6
National Park Service Upper Columbia Basin Network
7
National Park Service Upper Columbia Basin Network
Resource Availability and Selection
- Issues of scale at what scale is selection
occurring and important?
- Multiple patterns can arise from a single
process or mechanism - multiple processes can
lead to the same pattern
- Selecting the best model the best may not be
the goodinformation-theoretics, model
validation, etc
- Adaptive management we can evaluate multiple
hypotheses, use monitoring data to update
predictions, adjust management, etc
8
National Park Service Upper Columbia Basin Network
Occupancy Estimation
Pr(h1 101) ?p1(1-p2)p3, Where ?
probability site is occupied (or used) and p
probability of detecting the species during that
survey.
9
National Park Service Upper Columbia Basin Network
American pika, Ochotona princeps
10
National Park Service Upper Columbia Basin Network
11
National Park Service Upper Columbia Basin Network
Craters of the Moon National Monument and Preserve
Huddles Hole
Methods
Monument
- 2007-2008 2-week September survey June 2008
survey - 12 m radius site search area 20 minute search
time - Established detection with direct and indirect
sign - Focused sampling frame w/in 1 km roads/trails
120 sample units revisited 2x - Site and sample-specific covariates (lava
complexity, lava type, veg cover)
Laidlaw Park
Wapi Flow
Craters of the Moon National Monument and Preserve
12
National Park Service Upper Columbia Basin Network
Results
Overall occupancy site use (n72) was low and
patchily distributed
Occupancy (?) 0.2 Detectability (p) 0.92
13
National Park Service Upper Columbia Basin Network
14
National Park Service Upper Columbia Basin Network
Huddles Hole
Monument
!!!
?
Laidlaw Park
Wapi Flow
Craters of the Moon National Monument and Preserve
15
National Park Service Upper Columbia Basin Network
Habitat selection in a pinyon-juniper woodland
rodent community - City of Rocks NR and Castle
Rocks SP
16
Juniperus osteosperma
Pinus monophylla
Tamias dorsalis
City of Rocks
17
Peromyscus truei
18
(No Transcript)
19
(No Transcript)
20
(No Transcript)
21
Pinyon Ips (Ips confusus) infestation
22
National Park Service Upper Columbia Basin Network
Methods
- Sampled 44 sites in P-J woodland habitat. Used
Principal Components Analysis (PCA) to distill
the range of fundamental environmental
characteristics down to 1 gradient - Rocky P-J with bare ground and low understory veg
cover to P-J far from rock with dense understory
vegetation Axis 1
23
Heterogeneity!
24
- AXIS 1
Increasing bare ground and rock
Increasing understory vegetation
25
(No Transcript)
26
In Conclusion.
- P. truei DOES occur at City of Rocks in Cassia
Co., Idaho
- Rodent occupancy/use patterns reflect dominant
environmental gradients
- Both P. truei and T. dorsalis exhibit a
propensity to use well-developed P-J sites with
open understory and a significant rock component
- Together with species like juniper titmouse,
represent a unique P-J fauna and reflect P-J
structural conditions. P-J mgmt implications!
- How might these relationships change over time
at the periphery?
- Occupancy modeling, with non-traditional
design components (e.g. few traps per site)
presents a viable long-term monitoring approach.


