
Escherichia Coli Fermentation' - PowerPoint PPT Presentation
1 / 1
Title:
Escherichia Coli Fermentation'
Description:
Ethanol from plant biomass is valuable because it could be used to replace ... Metabolic Pathway Diagram (1) Wild Type E. ... 1.2593 / cell mass = specific rate ... – PowerPoint PPT presentation
Number of Views:310
Avg rating:3.0/5.0
Title: Escherichia Coli Fermentation'
1
Escherichia Coli Fermentation. Tanya Phillips,
Tristan Pritchard-Meaker, Dr. Ramon Gonzolaz, Dr.
Jacqueline Shanks
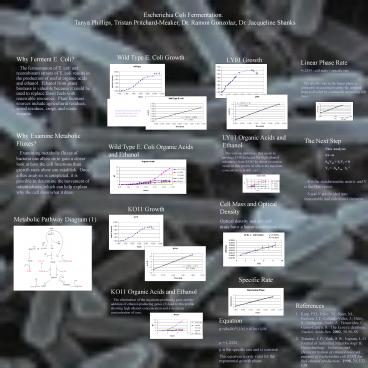
Wild Type E. Coli Growth
Why Ferment E. Coli? The fermentation of E.
coli and recombinant strains of E. coli results
in the production of useful organic acids and
ethanol. Ethanol from plant biomass is valuable
because it could be used to replace fossil fuels
with renewable resources. Plant biomass sources
include agricultural residues, wood residues,
crops, and waste streams.
LY01 Growth
- Linear Phase Rate
- 1.2593 / cell mass specific rate
- The specific rate in the linear phase is
constantly decreasing because the constant slope
is divided by continually increasing cell mass.
- Why Examine Metabolic Fluxes?
- Examining metabolic fluxes of bacteria can
allow us to gain a closer look at how the cell
functions than growth rates alone can establish.
Once a flux analysis is completed, it is possible
to determine the movement of intermediates, which
can help explain why the cell does what it does.
LY01 Organic Acids and Ethanol The various
mutations that occur to produce LY01(selected for
high ethanol tolerance) from KO11 by direct
evolution result in this profile in which the
succinate concentration is still zero.
The Next Step Flux Analysis SV0 SmVm ScVc
0 Vc -SmVm . Sc-1 S is the stoichiometric
matrix and V is the flux vector. S and V are
divided into measurable and calculated elements.
Wild Type E. Coli Organic Acids and Ethanol
Cell Mass and Optical Density Optical density and
dry cell mass have a linear correlation.
KO11 Growth
Metabolic Pathway Diagram (1)
Specific Rate
KO11 Organic Acids and Ethanol The elimination
of the succinate-producing gene and the addition
of ethanol-producing genes (2) lead to this
profile showing high ethanol concentration and a
succinate concentration of zero.
- References
- Karp, P.D. Riley, M. Saier, M. Paulsen, I.T.
Collado-Vides, J. Paley, S. Pellegrini-Toole,
A. Bonavides, C. Gama-Castro, S. The Ecocyc
database. Nucleic Acids Res. 2002, 30,56-58 - 2. Yomano, L.P. York, S.W. Ingram, L.O.
Journal of Industrial Microbiology
Biotechnology. Isolation and characterization of
ethanol-tolerant mutants of Escherichia coli KO11
for fuel ethanol production. 1998, 20, 132-138
- Equation
- m(dx/dt)(1/x) d(ln(x))/dt
- m 1.2524
- m is the specific rate and is constant
- This equation is only valid for the
exponential growth phase.
Recommended
CrystalGraphics Presentations


