
DavissonGermer experiment - PowerPoint PPT Presentation
1 / 11
Title:
DavissonGermer experiment
Description:
A beam of accelerated electrons strikes on a layer of ... 1 2 3 4 5 6 7 8. 1 2 3 4 5 6 ... much higher and so the wavelength is correspondingly shorter. ... – PowerPoint PPT presentation
Number of Views:586
Avg rating:5.0/5.0
Title: DavissonGermer experiment
1
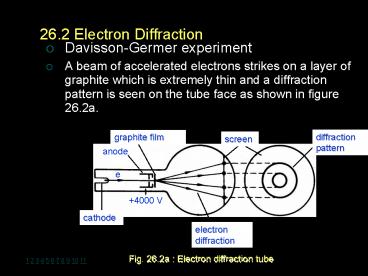
26.2 Electron Diffraction
- Davisson-Germer experiment
- A beam of accelerated electrons strikes on a
layer of graphite which is extremely thin and a
diffraction pattern is seen on the tube face as
shown in figure 26.2a.
4000 V
1 2 3 4 5 6 7 8
1 2 3 4 5 6 7 8 9 10 11
2
- This experiment made by Davisson and Germer
proves the de Broglie relation was right where
the wavelength of the electron is given by - If the velocity of electrons is increased, the
rings are seen to become narrower showing that
the wavelength of electrons decreases with
increasing velocity as predicted by de Broglie
(eq. 26.2a).
where
1 2 3 4 5 6 7 8
1 2 3 4 5 6 7 8 9 10
1 2 3 4 5 6 7 8 9 10 11
3
- The velocity of electrons are controlled by the
- applied voltage V across anode and cathode
- where
since
and
By substituting eq. (26.2b) into eq. (26.2a),
thus eq. (26.2a) can be written as
1 2 3 4 5 6 7 8
1 2 3 4 5 6 7 8 9 10
1 2 3 4 5 6 7 8 9 10 11
4
- Electrons are not the only particles which behave
as waves. - The diffraction effects are less noticeable with
more massive particles because their momenta are
generally much higher and so the wavelength is
correspondingly shorter. - Diffraction of the particles are observed when
the wavelength is of the same order as the
spacing between plane of the atom.
1 2 3 4 5 6 7 8 9 10 11
5
- Example 3
- a. An electron is accelerated from rest through
a potential difference of 1200 V. Find its de
Broglie wavelength. - b. An electron and a photon has the same
wavelength of 0.250 nm. Calculate the momentum
and energy (in eV) of the electron and the
photon. - (Given c 3.00 x 10⁸ m s-1, h 6.63 x 10⁻³⁴ J
s , 1 eV1.60 x 10-19 J, mass of electron, m
9.11 x 10⁻³¹ kg, e 1.60 x 10⁻¹⁹ C )
1 2 3 4 5 6 7 8
1 2 3 4 5 6 7 8 9 10
1 2 3 4 5 6 7 8 9 10 11
6
- Ans For electron
- a. ? 2.75 x 10⁻¹¹ m
- b. p 3.16 x 10⁻²⁴ kg m s-1
- K 34.3 eV
1 2 3 4 5 6 7 8
1 2 3 4 5 6 7 8 9 10
7
- Example 4
- Compare the de Broglie wavelength of an electron
and a proton if they have the same kinetic
energy. - (Given h 6.63 x 10⁻³⁴ J s ,1 eV1.60 x 10-19
J, me 9.11 x 10⁻³¹ kg, mp 1.67 x 10⁻²⁷ kg )
1 2 3 4 5 6 7 8 9 10
8
- Ans 42.8
1 2 3 4 5 6 7 8 9 10
1 2 3 4 5 6 7 8 9 10 11
9
26.3 Electron Microscope
- A practical device that relies on the wave
properties of electrons is electron microscope. - It is similar to optical compound microscope in
many aspects. - The advantage of the electron microscope over the
optical microscope is the resolving power of the
electron microscope is much higher than that of
an optical microscope. - This is because the electrons can be accelerated
to a very high kinetic energy giving them a very
short wavelength ? typically 100 times shorter
than those of visible light. Therefore the
diffraction effect of electrons as a wave is much
less than that of light. - As a result, electron microscopes are able to
distinguish details about 100 times smaller.
1 2 3 4 5 6 7 8
1 2 3 4 5 6 7 8 9 10
1 2 3 4 5 6 7 8 9 10 11
10
- In operation, a beam of electrons falls on a thin
slice of sample. - The sample (specimen) to be examined must be very
thin (a few micrometres) to minimize the effects
such as absorption or scattering of the
electrons. - The electron beam is controlled by electrostatic
or magnetic lenses to focus the beam to an image. - The image is formed on a fluorescent screen.
- There are two types of electron microscopes
- Transmission produces a two-dimensional image.
- Scanning produces images with a
three-dimensional quality.
1 2 3 4 5 6 7 8
1 2 3 4 5 6 7 8 9 10
1 2 3 4 5 6 7 8 9 10 11
11
- Figures 26.3a and 26.3b are diagram of the
transmission electron microscope and the scanning
electron microscope.
1 2 3 4 5 6 7 8 9 10 11
Recommended
CrystalGraphics Presentations


