
The Citric Acid Cycle - PowerPoint PPT Presentation
1 / 77
Title:
The Citric Acid Cycle
Description:
The Conversion of Pyruvate to Acetyl-CoA Involves Multiple Coupled Redox Reactions ... Citrate Synthase Generates Citrate from Acetyl-CoA and Oxaloacetate ... – PowerPoint PPT presentation
Number of Views:491
Avg rating:3.0/5.0
Title: The Citric Acid Cycle
1
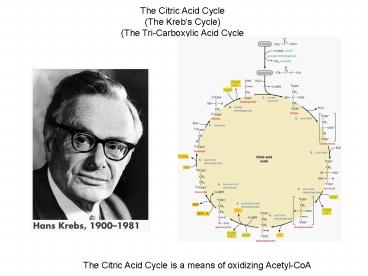
The Citric Acid Cycle (The Krebs Cycle) (The
Tri-Carboxylic Acid Cycle
The Citric Acid Cycle is a means of oxidizing
Acetyl-CoA
2
Overview. Connections Among the Glycolytic,
Citric Acid Cycle, and Oxidative Phosphorylation
Events
Figure Lehninger, 5th Edition.
3
Pyruvate Dehydrogenase Generates Acetyl-CoA (The
Input to the Citric Acid Cycle)
Production of carbon dioxide before entry into
Citric Acid Cycle.
Figure Lehninger, 5th Edition.
4
The Conversion of Pyruvate to Acetyl-CoA Involves
Multiple Coupled Redox Reactions
Figure VV, 3rd Edition.
5
Acetyl Coenzyme A (Acetyl-CoA)
6
2 C
6 C
4 C
4 C
6 C
6 C (lose CO2)
4 C
5 C (lose CO2)
4 C
4 C
Figure Lehninger, 5th Edition.
7
oxaloacetic acid
citric acid
isocitric acid
a-ketoglutaric acid
Citric Acid Cycle Metabolites
succinic acid
fumaric acid
malic acid
succinyl-CoA
8
Citrate Synthase Generates Citrate from
Acetyl-CoA and Oxaloacetate
Figure Lehninger, 5th Edition.
9
Mechanism of Citrate Synthase I
Figure Lehninger, 5th Edition.
10
Mechanism of Citrate Synthase II
Figure Lehninger, 5th Edition.
11
Mechanism of Citrate Synthase III
Figure Lehninger, 5th Edition.
12
The Interconversion of Citrate and Isocitrate by
Aconitase
Figure Lehninger, 5th Edition.
13
Detail of the Aconitase Active Site Aconitase
Distinguishes Between pro-R and pro-S Arms of
Citrate
14
Oxidation and Decarboxylation of Isocitrate
Through Isocitrate Dehydrogenase
First production of NADH in the Citric Acid
Cycle First production of carbon dioxide in the
Citric Acid Cycle
Figure Lehninger, 5th Edition.
15
Dehydrogenation
First production of NADH in the Citric Acid Cycle
Figure Lehninger, 5th Edition.
16
Decarboxylation
First loss of carbon dioxide in the Citric Acid
Cycle
Enolate intermediate
Figure Lehninger, 5th Edition.
17
Keto-Enol Tautomerization Protonation
Figure Lehninger, 5th Edition.
18
Oxidation of a-Ketoglutarate to Succinyl-CoA
5 C
4 C
a-ketoglutarate dehydrogenase
NAD, CoA
Second production of NADH in the Citric Acid
Cycle Second production of carbon dioxide in the
Citric Acid Cycle Reaction entirely analogous to
pyruvate dehydrogenase a-keto acid dehydrogenase
family pyruvate dehydrogenase a-ketoglutarate
dehydrogenase branched-chain a-keto acid
dehydrogenase
19
Succinyl-CoA Synthetase Generates GTP Converts
Succinyl-CoA to Succinate (Named for the Reverse
Reaction)
succinyl-CoA synthetase
GTP
PO42- , GDP
First (only) generation of GTP (ATP) in the
Citric Acid Cycle Substrate-level phosphorylation
i.e. production of GTP (ATP) in the same manner
as in glycolysis.
20
Succinyl-CoA Synthetase Mechanism I
Due to the high lability of the CoA-succinate
ester, a phosphate ion is readily transferred to
succinate. CoA is released, and a
succinyl-phosphate intermediate occurs.
Figure VV, 3rd Edition
21
Succinyl-CoA Synthetase Mechanism II
Observation Incubation of 14C-ADP and ATP in
the presence of Succinyl-CoA synthetase
yields 14C-ATP. Evidence for a phospho-enzyme
intermediate.
Adenosine PO4- PO42- Adenosine PO4-
PO4- PO42-
Adenosine PO4- PO4- PO42- Adenosine
PO4- PO42-
22
Succinyl-CoA Synthetase Mechanism III
Figure VV, 3rd Edition
23
Succinyl-CoA Synthetase Mechanism IV
Figure VV, 3rd Edition
24
Succinate Dehydrogenase Generates FADH2
succinate dehydrogenase
Rule of Thumb NAD Oxidation of alcohols to
aldehydes, ketones oxidative decarboxylations (hi
gh chemical potential, larger negative DG on
reduction) FAD Oxidation of alkanes to
alkenes (lower chemical potential, smaller
negative DG on reduction)
FAD covalently linked to the enzyme not a
traditional cofactor not released on
reduction Enzyme is also part of Oxidative
Phosphorylation Machinery (Complex II)
25
The Covalently Attached FAD Cofactor in Succinate
Dehydrogenase
Figure VV, 3rd Edition
26
Oxidized and Reduced Forms of Flavin Adenine
Dinucleotide, FAD(H2)
Oxidized
Reduced
27
Fumarase Converts Fumarate into Malate
fumarase
Reaction is a (stereospecific) addition of water
across a carbon carbon double bond. A
carbanion intermediate occurs -OH adds before H.
28
Malate Dehydrogenase Generates the 3rd NADH of
the Citric Acid Cycle and Regenerates the
Oxaloacetate Substrate for Citrate Synthase
NADH
29
Standard and Physiological Free Energy Changes in
the Citric Acid Cycle
What drives the cycle forward?
Figure VV, 3rd Edition
30
Free Energy of the Conversion of Malate to
Oxaloacetate The Last Reaction
NADH
DG 29.7 kJ/mol Thus the equilibrium strongly
favours malate.
Free Energy of the Conversion of Oxaloacetate to
Citrate The First Reaction
DG -31.5 kJ/mol The equilibrium strongly
favours citrate. Citrate is favoured more than
malate. Thus, overall, the citric acid cycle is
driven forward.
31
Overall Reaction of the Citric Cycle
3 NAD FAD GDP PO42- CoAS-OAc
3 NADH FADH2 GTP CoASH 2 CO2
Note that an NADH and a CO2 are also produced in
the decarboxylation of pyruvate.
32
Oxidative Phosphorylation
33
Review of The Mitochondrion
As many as 2000 mitochondria per
cell. Appoximately the size of a bacterium
probably evolutionarily derived from
bacteria. Extensively invaginated inner
membrane. Inter-membrane space continuous with
cytosol. Matrix space separate metabolites,
proteins, ADP, ATP, etc. Site of the Citric Acid
Cycle Site of oxidative phosphorylation.
34
Detail of Mitochondrial Membranes
Membranes physical barriers. What about
metabolites (NADH) that cant cross the
mitochondrial membrane?
35
NADH Does NOT Enter the Mitochondrion
Directly The Malate-Aspartate Shuttle System
Mitochondrial inter-membrane space cytoplasm
Mitochondrial matrix
Cytosolic oxaloacetate converted to cytosolic
malate by malate dehydrogenase. Consumes
NADH. Cytosolic malate crosses into matix through
malatea-ketoglutarate carrier. Mitochondrial
matrix malate converted to mitochondrial
oxaloacetate by mitochondrial malate
dehydrogenase. NADH produced. Therefore, net
transfer of NADH from cytosol to matrix.
36
Electrochemical View of Glycolysis and the Citric
Acid Cycle
6 CO2 6 H2O DG-2823 kJ/mol
C6H12O6 6 O2
As electrochemical half reactions
Oxidation of glucose
C6H12O6 6 H2O
6 CO2 24 H 24 e-
Reduction of oxygen
6 O2 24 H 24 e-
12 H2O
37
Review of Electrochemistry
The Cell Potential Potential Difference of
the electrochemical reaction (i.e., the voltage)
E E(acceptor) E (donor)
Reduction
Oxidation
The potential differences associated with
electron transfer reactions are always given as
Reduction Potentials
NAD H 2 e-
NADH E-0.315 V
½ O2 2 H 2 e-
H2O E0.815 V
38
What is the Potential Difference for the
Oxidation of NADH by O2?
NAD 2 H 2 e-
NADH H E-0.315 V
½ O2 2 H 2 e-
H2O E0.815 V
NADH is oxidized but we have information for the
reduction of NAD. The negative of the reduction
potential is the oxidation potential.
NAD 2 H 2 e- E0.315 V
H NADH
½ O2 2 H 2 e-
H2O E0.815 V
NADH ½ O2 3 H 2 e-
NAD 2 H 2 e- H2O
NADH ½ O2 H
NAD H2O E1.130 V
39
Free Energy Changes in Electrochemical Reactions
NADH ½ O2 H
NAD H2O E1.130 V
DG - nFE in which
n number of electrons involved F Faraday
constant 96 485 C/mol 96 485 J/(V
mol) E potential difference
DG - (2) (96485 J/(V mol)) (1.130 V) DG -
218 kJ/mol
40
NADH Does NOT Enter the Mitochondrion
Directly The Malate-Aspartate Shuttle System
Mitochondrial inter-membrane space cytoplasm
Mitochondrial matrix
Cytosolic oxaloacetate converted to cytosolic
malate by malate dehydrogenase. Consumes
NADH. Cytosolic malate crosses into matix through
malatea-ketoglutarate carrier. Mitochondrial
matrix malate converted to mitochondrial
oxaloacetate by mitochondrial malate
dehydrogenase. NADH produced. Therefore, net
transfer of NADH from cytosol to matrix.
41
Proteins Involved in the Electron Transport Chain
Note the translocation of protons. Note the
absence of complex II.
42
Complex I NADHCoenzyme Q Oxidoreductase
Point at which Citric Acid Cycle derived NADH
enters oxidative phosphorylation. NADH reoxided.
2 e- process. Coenzyme Q reduced. 2 e-
process. 4 protons driven from mitochondrial
matrix to inner membrane space Sufficient to
drive ATP synthesis. ( 3 ½ protons required)
43
Complex II SuccinateCoenzyme Q Oxidoreductase
Point at which FADH2 enters oxidative phosphorylat
ion. FADH2 reoxided. 2 e- process Coenzyme Q
reduced. 2 e- process. Insufficient to drive ATP
synthesis. But, these are relatively
high potential electrons, and they contribute to
ATP synthesis in subsequent e- transfers.
44
Succinate Dehydrogenase Generates FADH2 Enzyme is
also part of Oxidative Phosphorylation Machinery
(Complex II)
succinate dehydrogenase
Oxidized
Reduced
Oxidized
Reduced
45
CoQ
Oxidation States of Coenzyme Q One and two
electron processes are possible at these centres
46
Iron Sulfur Complexes Common in the Electron
Transport Chain Generally one electron processes
occur at these centres.
47
Disposition of Redox Centers in Complex II
In general, redox centres are not in direct
contact with one-another. Thus suggests that
electrons jump from one to the other. (Quantum
mechanical tunneling)
48
Complex III Coenzyme QCytochrome c
Oxidoreductase
Coenzyme Q is reoxidized in several one electron
processes. The stable radical form of Coenzyme Q
is essential for this chemistry. Two cytochrome
c proteins are reduced in two separate one
electron processes. Four protons are driven from
the matrix to the inner membrane
space. Sufficient to drive ATP synthesis
49
Complex IV Cytochrome c Oxidase
Last electron transfers of oxidative
phosphorylation. Four subsequent one electron
cytochrome c oxidations One, four
electron, reduction of one O2 molecule to yield
2 water molecules. Four protons are driven from
the matrix to the inner membrane
space. Sufficient to drive ATP synthesis.
50
Electrochemistry of the Electron Transport Chain
Reduction Potential
51
Generation of the Proton Gradient Through the
Electron Transport Chain
52
The Proton Gradient and the Generation of ATP
The Chemical Potential
53
The Proton Gradient and the Generation of ATP
Electrochemical View The Nernst Potential
E Potential difference R Gas constant F Faraday
constant z charge
54
The Proton Pump in Bacteriorhodopsin
55
Complex V The F0F1 ATPase
F1
F0
F1 Water soluble site of ATP synthesis
(hydrolysis). F2 Membrane bound, water
insoluble site of proton translocation..
56
Complex V The F0F1 ATPase
F1 Water soluble site of ATP synthesis
(hydrolysis). a, b, g, d subunits. F0
Membrane bound, water insoluble site of proton
translocation. a, b, c subunits.
57
F0F1 ATPase Can be Separated into F0 and F1 Units
F1 units are lollipop shaped. a3b3gde
58
F0 Assembly Membrane Spanning Multi-subunit
protein ab2c9-12
c subunit site of protonation transfer equilibria
Electron micrograph reconstruction of F0
assembly. Looking down on membrane spanning
helices.
59
Protonation Equilibria in c Subunit Monomers
pH 8 D61 deprotonated coiled-coil is kinked Y73
group rotated out
pH 5 D61 protonated coiled-coil is straight Y73
group rotated in
The protonation state of D61 induces a
torque. Conversion of chemical and mechanical
energy.
60
F0F1 ATPase Can be Separated into F0 and F1 Units
F1 units are lollipop shaped. a3b3gde
61
X-ray Crystal Structure of Bovine Heart
Mitochondria F1 Assembly
- Showing a3b3g subunits
- a and b subunits
- Pseudo 3-fold symmetry.
- subunit breaks symmetry
- 3 different conformations
- in ab dimers.
aEbE empty (open) aDPbDP ADP
(loose) aTPbTP ATP, synthetic site, (tight)
20 Å
62
Symmetry
3 Fold (C3) Symmetric Each 120 rotation (360 /
3) reproduces original
Psuedo 3-Fold Symmetric Presence of the
line breaks the rotational symmetry Each segment
unique.
63
Speaking of Rotation
A system for direct visualization of rotation in
the F0F1 ATPase
64
The F0F1 ATPase is a Rotary Motor
65
If Its a Rotary Motor, What is it Rotating
Around?
View of electron density at a slice through the
F1 fragment.
Backbone trace yellow ab subunits blue g
subunit orange nucleotide ball and stick.
The ab subunits rotate around the g subunit.
66
Top Down View of F1 Assembly
Surface potentials. Red negative charge Blue
positive charge White hydrophobic
surface. Note the hydrophobicity of the interior
cavity this is where the g subunit goes.
67
View of the F1 Stalk The g, d, and e Subunits
Hydrophobic.
Cyan g-subunit, visible in the above. Blue
remainder of g-subunit. Green
d-subunit. Magenta e-subunit.
Point of attachment to F0.
68
View of F1 Assembly and c10 Multimer of F0
69
The F0F1 ATPase The Whole E. coli Assembly
70
Disposition of the g Subunit With Respect to the
a3b3 Assembly Three Different Sites, and the
Synthesis of ATP
L State Loose binds ADP and Pi loosely. T
State Tight catalytically acitve, generates
ATP. O State Open binds nothing, is distorted
permits release of ATP.
71
Additional Slides
72
Conformational Changes in Citrate Synthase
Open Substrate free form
Closed Substrate bound form
Figure Lehninger, 5th Edition.
73
Oxidation of a-Ketoglutarate to Succinyl-CoA
Second production of NADH in the Citric Acid
Cycle Second production of carbon dioxide in the
Citric Acid Cycle
Figure Lehninger, 5th Edition.
74
Oxidation and Decarboxylation of Isocitrate
Through Isocitrate Dehydrogenase
6 C
5 C
First production of NADH in the Citric Acid
Cycle First production of carbon dioxide in the
Citric Acid Cycle
Figure Lehninger, 5th Edition.
75
Isocitrate Dehydrogenase I
Figure Lehninger, 5th Edition.
76
Isocitrate Dehydrogenase II
Figure Lehninger, 5th Edition.
77
Isocitrate Dehydrogenase III
Figure Lehninger, 5th Edition.
Recommended
CrystalGraphics Presentations


