Numerical Simulation of Tropical Strom
1 / 1
Title:
Numerical Simulation of Tropical Strom
Description:
The South East Asia has the effects of typhoon and tropical cyclone every year. ... diurnal mode of summer rainfall across the conterminous United States in 10-km ... –
Number of Views:74
Avg rating:3.0/5.0
Title: Numerical Simulation of Tropical Strom
1
Numerical Simulation of Tropical Strom over
Upper Thailand by WRF Ratjiranukool P. ,
Inthacha S. and Kreasuwun J. Department of
Physics, Faculty of Science, Chiang Mai
University, Muang, Chiang Mai, 50200 Thailand.
Abstract
The South East Asia has the effects of typhoon
and tropical cyclone every year. In this paper
investigated the effect of the O2B cyclone
developed in the Andaman sea during May 14-20,
2004 on the heavy rainfalls and severe floods in
Tak province and nearby areas and The Chanthu
typhoon developed in the South China Sea moving
north-westward to Thailand during June 9-15, 2004
caused heavy rainfalls in Phitsanulok province.
Wind vectors, storm track and rainfalls over the
study areas were simulated by WRF which is the
non-hydrostatic and terrain-following regional
weather model. The tracks of the storms agreed
well with satellite images.
Results
Introduction
Numerical weather simulation is based on the
variability and relationship of the environmental
variables such as temperature, pressure, wind
velocity, updraft or downdraft, humidity and
topography. The typhoon passage frequency
decreased significantly in the East China Sea and
Philippine Sea, but increased slightly in the
South China Sea. The time series of typhoon
passage frequency over the East China Sea and
South China Sea further reveal a regime shift in
the late1970s.
Methodology
1. Analyze the cyclone by the Weather Research
Forecasting model (WRF), the latest
non-hydrostatic mesoscale model developed by
National Center for Atmospheric Research (NCAR),
United State, at ten-kilometer resolution. 2.
Analyze and display the WRF output e.g. the wind
vector, the cyclonic flow, the track,
precipitation etc. by Grid Analysis and
Displaying System (GrADS). 3. Estimate
horizontal wind speed, track of cyclonic flow,
precipitation etc.
May 14, 2004
May 16, 2004
May 17, 2004
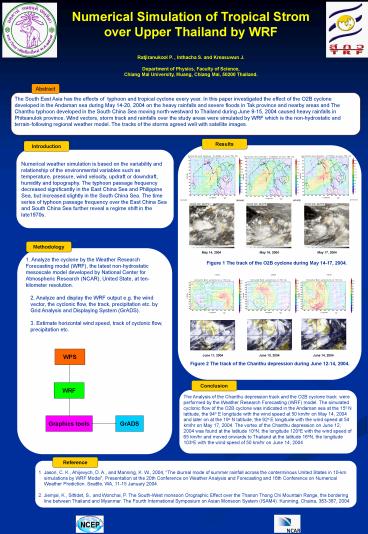
Figure 1 The track of the O2B cyclone during May
14-17, 2004.
Figure 2 The track of the Chanthu depression
during June 12-14, 2004.
Conclusion
The Analysis of the Chanthu depression track and
the O2B cyclone track were performed by the
Weather Research Forecasting (WRF) model. The
simulated cyclonic flow of the O2B cyclone was
indicated in the Andaman sea at the 15o N
latitude, the 94o E longitude with the wind speed
at 50 km/hr on May 14, 2004 and later on at the
19o N latitude, the 92o E longitude with the wind
speed at 54 km/hr on May 17, 2004. The vortex of
the Chanthu depression on June 12, 2004 was found
at the latitude 10oN, the longitude 120oE with
the wind speed of 65 km/hr and moved onwards to
Thailand at the latitude 16oN, the longitude
103oE with the wind speed of 50 km/hr on June 14,
2004
Reference
- 1. Jason, C. K., Ahijevych, D. A., and Manning,
K. W., 2004, The diurnal mode of summer rainfall
across the conterminous United States in 10-km
simulations by WRF Model, Presentation at the
20th Conference on Weather Analysis and
Forecasting and 16th Conference on Numerical
Weather Prediction. Seattle, WA, 11-15 January
2004. - 2. Jiemjai, K., Sittidet, S., and Wonchai, P. The
South-West monsoon Orographic Effect over the
Thanon Thong Chi Mountain Range, the bordering
line between Thailand and Myanmar. The Fourth
International Symposium on Asian Monsoon System
(ISAM4). Kunming, Chaina, 383-387, 2004.


