
Historical Mercury Inputs to the Chesapeake Bay
1 / 1
Title:
Historical Mercury Inputs to the Chesapeake Bay
Description:
Industry and automotive emissions have substantially increased mercury inputs to ... this study attempts to discern trends in mercury pollution of the Chesapeake ... –
Number of Views:38
Avg rating:3.0/5.0
Title: Historical Mercury Inputs to the Chesapeake Bay
1
Historical Mercury Inputs to the Chesapeake
Bay Tristan Kading, Department of Marine
Sciences, University of Connecticut, Groton, CT
06340
Introduction Mercury introduced to the
environment is readily incorporated into the food
chain, becoming concentrated in fish at the
highest levels of the food chain. Industry and
automotive emissions have substantially increased
mercury inputs to the environment and as a result
many governmental organizations have taken
regulatory action, enacting policies to reduce
mercury pollution and advising certain sectors of
the population to decrease consumption of
seafood. However, the extent of increase in many
locations is not well known. Thus, this study
attempts to discern trends in mercury pollution
of the Chesapeake Bay and to date the timing of
major pollution events.
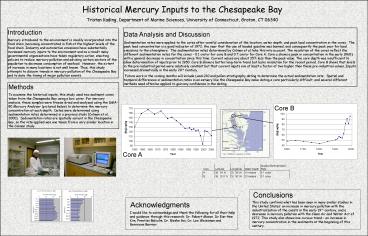
Data Analysis and Discussion Sedimentation rates
were applied to the cores after careful
consideration of the location, water depth, and
peak lead concentration in the cores. The peak
lead concentration is a good indicator of 1972,
the year that the use of leaded gasoline was
banned, and consequently the peak year for lead
emissions to the atmosphere. The sedimentation
rates determined by Colman et al take this into
account. The resolution of the cores reflect the
different sedimentation rates for the cores 0.1
cm/yr for core B and 0.7 cm/yr for Core A. Core a
shows a peak in concentration in the early 1960s
with a general decrease in concentration since
this time. Current values are about 35 less than
the peak value. The core depth was insufficient
to allow determination of inputs prior to 1950.
Core B shows a better long-term trend but lacks
resolution for the recent period. Core B shows
that levels in the pre-industrial period were
relatively constant but that current inputs are
at least a factor of two higher than these
pre-industrial values. Inputs increased
dramatically in the early 20th Century. Future
work in the coming months will include Lead-210
and pollen stratigraphy dating to determine the
actual sedimentation rate. Spatial and temporal
differences in sedimentation rates in an estuary
like the Chesapeake Bay make dating a core
particularly difficult, and several different
methods need often be applied to gain any
confidence in the dating.
Methods To examine the historical inputs, this
study used two sediment cores taken from the
Chesapeake Bay using a box corer. For mercury
analysis, these samples were freeze dried and
analyzed using the DMA-80 Mercury Analyzer
(pictured below) to determine the mercury
concentration at each depth. Dates were
determined using sedimentation rates determined
in a previous study (Colman et al, 2000).
Sedimentation rates are spatially variant in the
Chesapeake Bay, so the rate applied was one taken
from a very similar location in the Colman study.
Core B
Core B
Core A
Core A
Conclusions
This study confirms what has been seen in many
similar studies in the United States an increase
in mercury pollution with the industrialization
of the coasts in the early 19th century, and a
decrease in mercury pollution with the Clean Air
and Water Act of 1972. This study also shows one
curious trend an increase in mercury
concentration in the sediments at the beginning
of this century.
Acknowledgments
I would like to acknowledge and thank the
following for all their help and guidance through
this research Dr. Robert Mason, Dr Eun-Hee Kim,
Prentiss Balcolm, Dr. Moshe Gai, Dr. Leo Weissman
and Genivieve Bernier.
Recommended
CrystalGraphics Presentations


